
Accuracy testing of D-Log-M color management tools
Premise
Test the accuracy of the various color management tools I have available for DJI D-Log-M footage. These are;
A - Using the footage straight out of camera
B - Using the free LUT DJI provides
C- Using the power grade I released previously
D - Using LUT built by my recently published Python tool
E - Using Lut from LUTCalc Site
F - Using DCTL from Thatcher’s Github
TLDR:
| CST Method | Delta L 50%ile | Delta E Mean | Delta E Median |
|---|---|---|---|
| SOOC | 4.25 | 7.91 | 7.48 |
| DJI Lut | 3.64 | 7.61 | 7.41 |
| Prior Power Grade | 2.64 | 6.56 | 6.38 |
| Python Lut | 2.08 | 5.83 | 5.77 |
| LutCal | 2.91 | 7.5 | 7.7 |
| Thatcher DCTL | 2.68 | 7.1 | 7.28 |
We can see that the DJI lut shows remarkably bad results, not much better than no color management at all. The results from my Python program are even more accurate than the conversion power grade I previously built.
A comparison of these on actual footage is posted here;
www.zebgardner.com/photo-and-video-editing/d-log-m-color-management-lut-comparison
Background
DJI uses a proprietary color space for their low end drones, action cameras and the Osmo Pocket 2/3 called D-Log-M. Sadly DJI refuses to publish any documentation on this color space, so Black Magic is unable to incorporate it into the Davinchi Resolve color management system.
https://forum.dji.com/forum.php?mod=viewthread&tid=297669&extra=&page=1
DJI does publish a free lut to convert D-Log-M to Rec709, but as we will see, it is very inaccurate.
I have previously produced a Resolve power grade and LUT using a linear workflow to try and reverse engineer what the actual tone curve for D-log-M is as detailed here;
https://www.zebgardner.com/photo-and-video-editing/dji-d-log-m-colorgrading
This process quite time intensive though and doesn't have a great way to correct the colors from camera. So I worked to implement a similar process automated in Python.
This program does the same tone curve generation to minimize error in linear space. And it also generates a 3x3 matrix to convert color primaries to minimize CIE2000 color error. This was run on the 140 sample Color Checker SG color chart, so a much wider range of hues and saturations than the Color Checker Passport Video used in my prior efforts.
This program generates a 'Shaper Lut', that is first a 12 bit (4096 element) 1d lut to map the tone curve of D-Log-M to Davinchi Intermediate. Then a 65 cube 3d lut is applied to map the camera color space to Davinchi Wide Gammut.
Test Methodology
This article will do CIE2000 accuracy tests using Babel Color's Patch Tool to compare the accuracy of these 3 on the Color Checker SG color chart. I will also compare the straight out of camera error.
https://babelcolor.com/products.htm
The chart was lit with a high CRI LED light and the Mini 4 Pro white balance set to match the light temperature, 6500k. As the drone doesn't really have any proper metering tools, and DJI didn't publish a middle gray target for D-log-M, a best guess exposure was taken and we will normalize all 4 CST methods to minimize the exposure error.
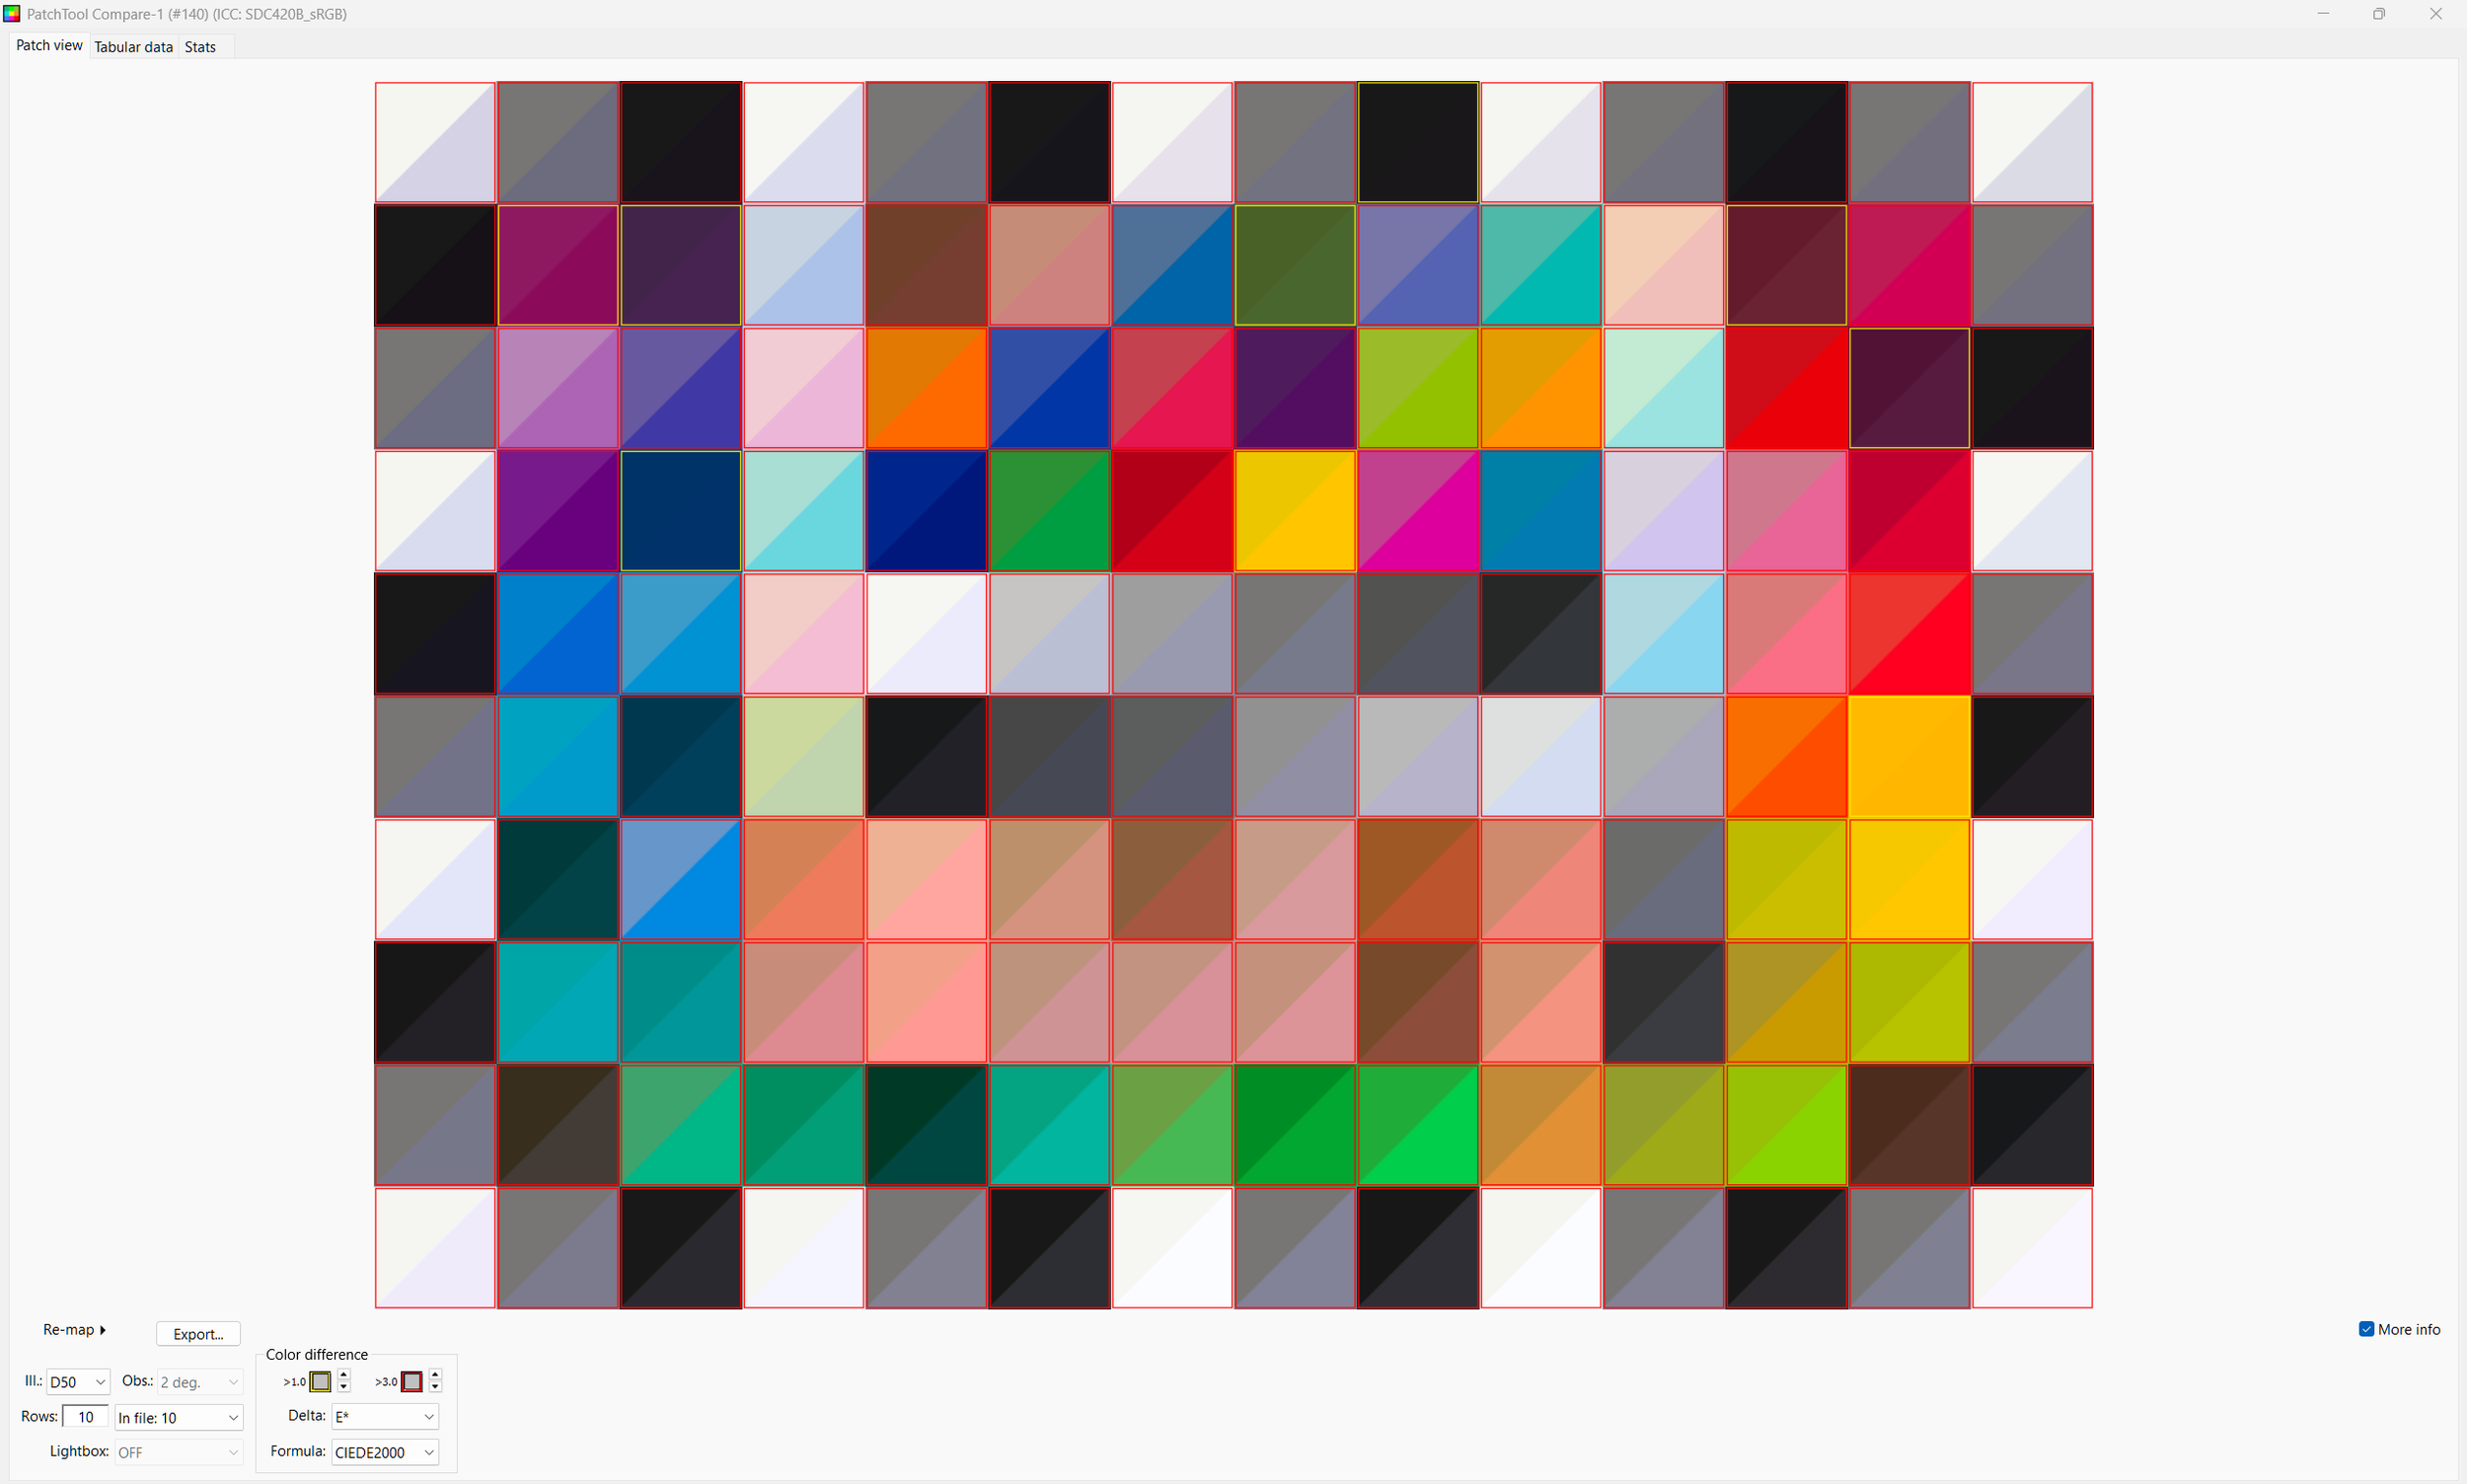
That shot is brought into Resolve. The automatic color management is off and we will build it manually with the luts and CSTs
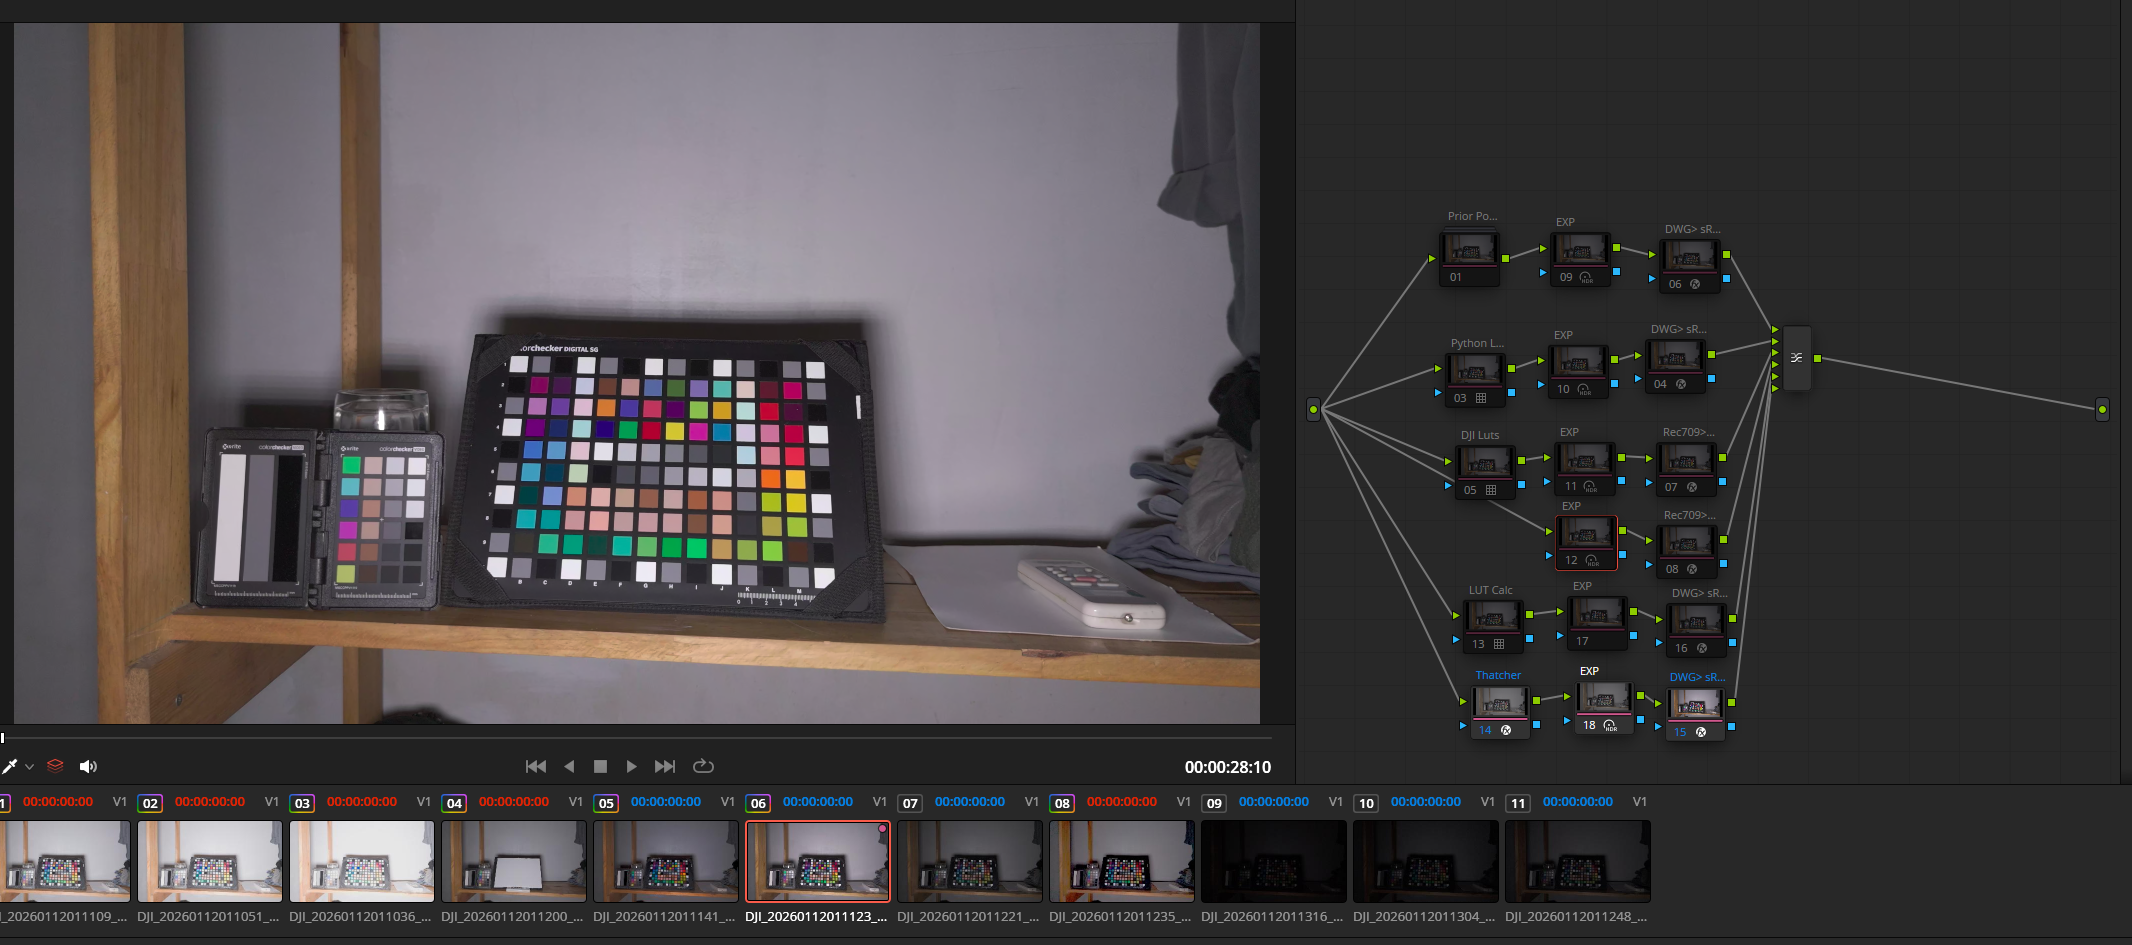
The top row is my prior power grade, it outputs in DWG/I, the next node is where will will do exposure adjustment with the HDR wheels ( it set to DWG/I), and last we have a DWG/I to sRGB CST. Patch tool requires sRGB
Second Row is the Lut produced by the python tool. It also outputs DWG/I so the following nodes match the top row.
Row 3 is the DJI lut. It outputs Rec709, so the HDR wheels for exposure correction is set to that, and the last CST is Rec709 to sRGB.
Row 4 is the 'Straight out of Camera', we just have the HDR wheels in Rec709 mode and the Rec709 to sRGB CST.
Row 5 is using a D-LOG-M to DWG/I lut from LutCalc, with the same DWG/I to sRGB node from row 2
https://lutcalc.net/run-lutcalc/6
Row 6 is using the D-Log-M to DWG DCTL from Thatcher's github
All 6 of these go to a layer mixer, so we can disable all but one raw, grab a still of that and bring it into Patch tool to test. And repeat for the other 5.
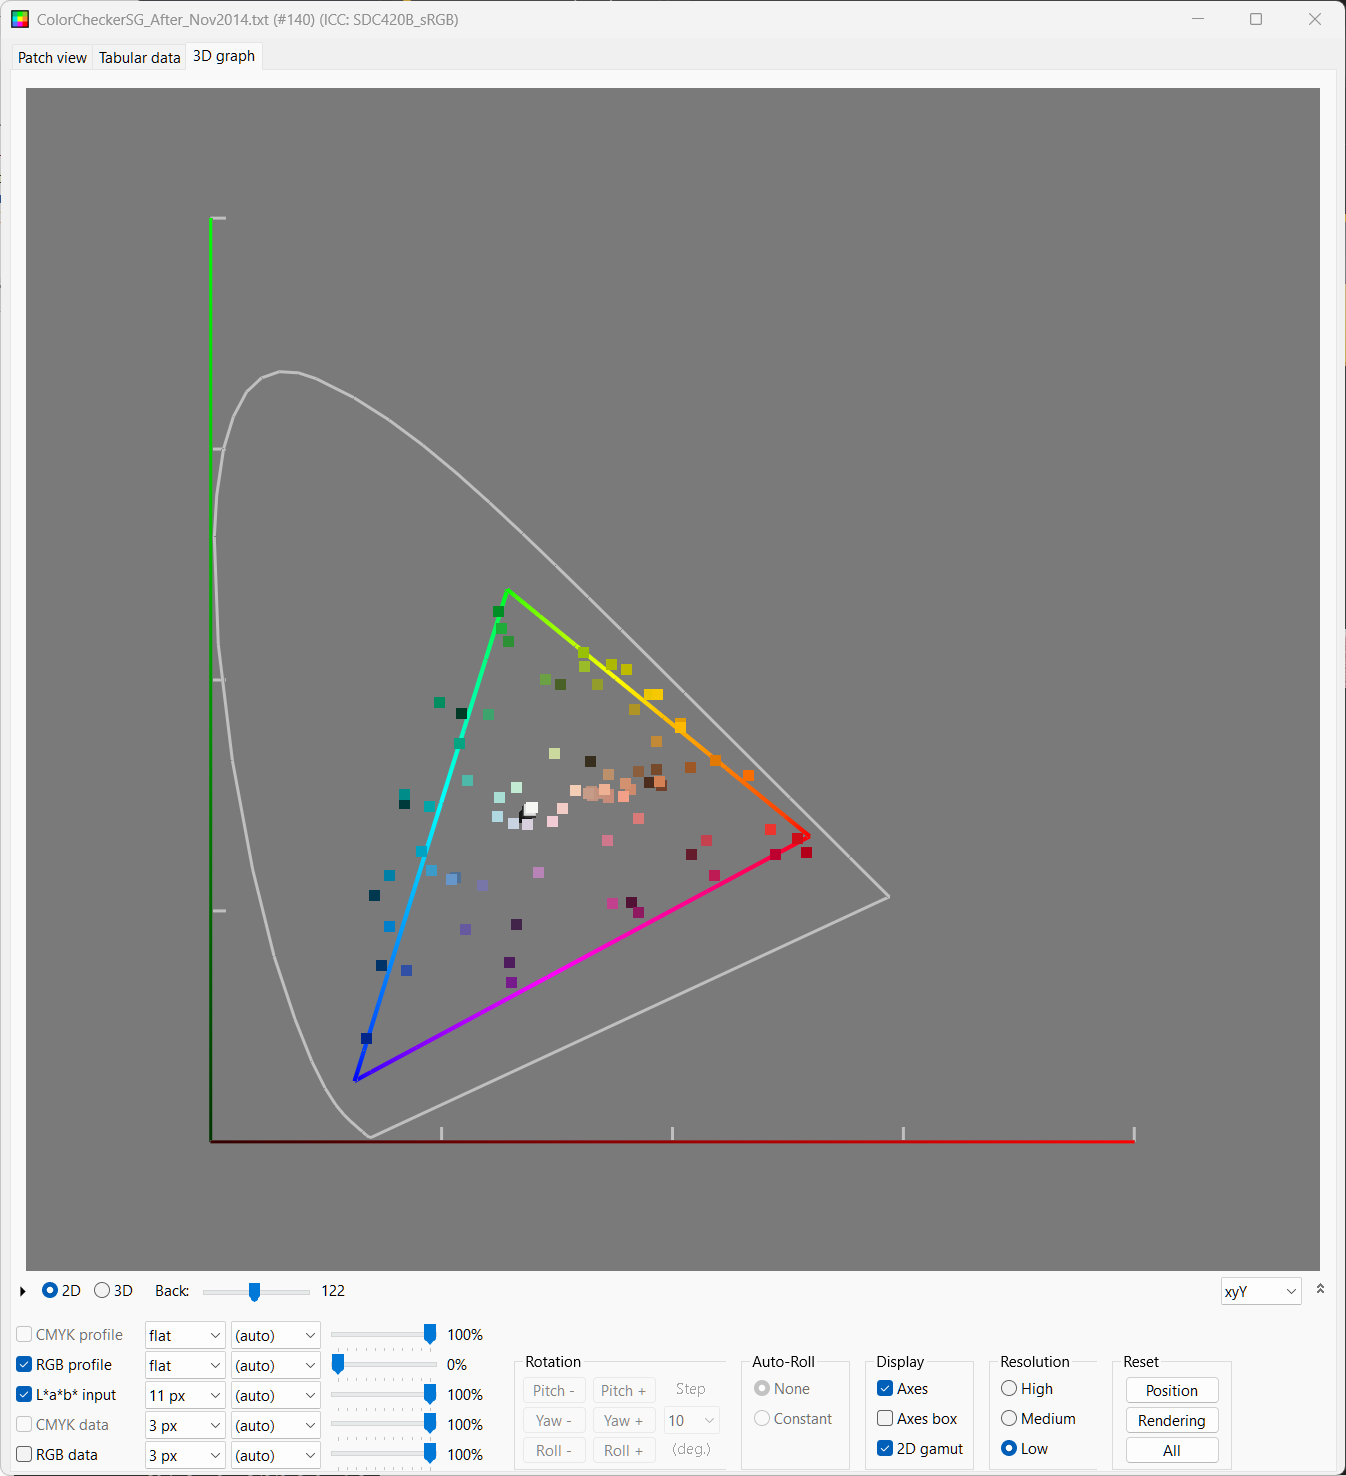
Patch Tool lets you highlight the 140 test patches and it reads the sRGB values out of the 8 bit png from Resolve (Patch Tool refuses 16 bit tiffs). These are compared against the LAB values X-rite published for the Color Checker SG.
https://babelcolor.com/index_htm_files/ColorCheckerSG_After_Nov2014.txt
Do note, it is not ideal to be comparing in sRGB, over a dozen of the chips on the CC-SG actually exceed the gammut of sRGB, so it would be impossible for them to produce a perfect score in Patch Tool. But I don't know of a good alternative, patch tool supports ProPhoto, but resolve doesn't, exporting in LAB space produces negative values. So we will have to accept that some chips will show incorrectly poor results due to the sRGB clipping, but this will be a equal problem for all 4 CST methods.
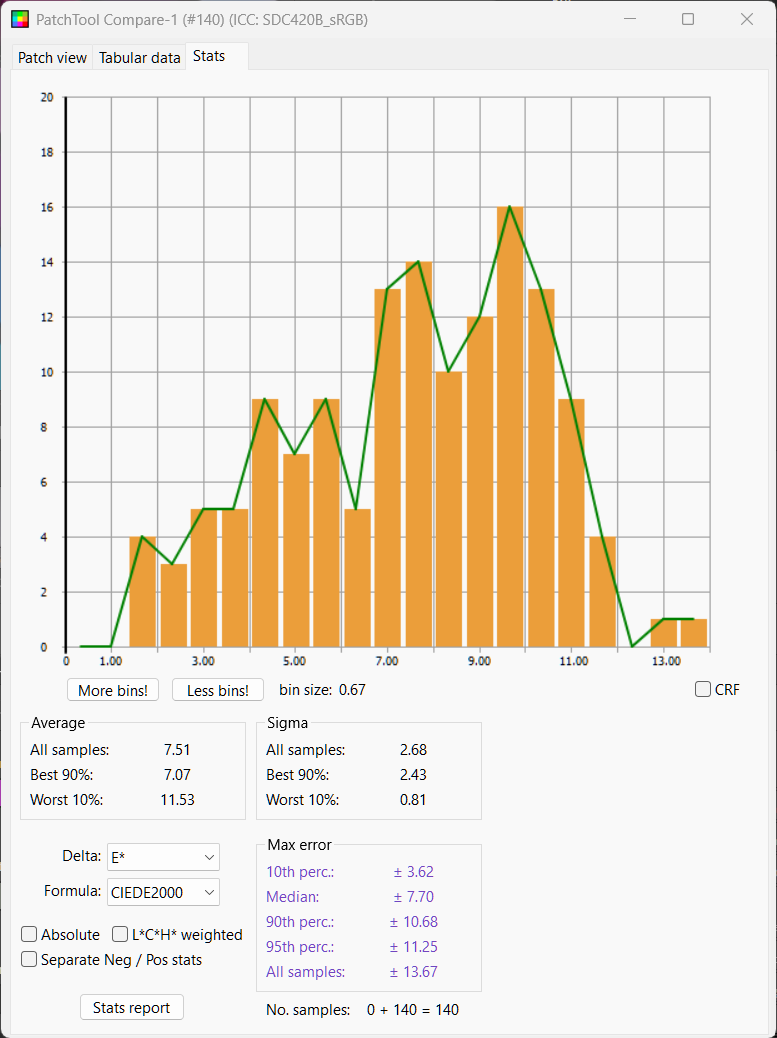
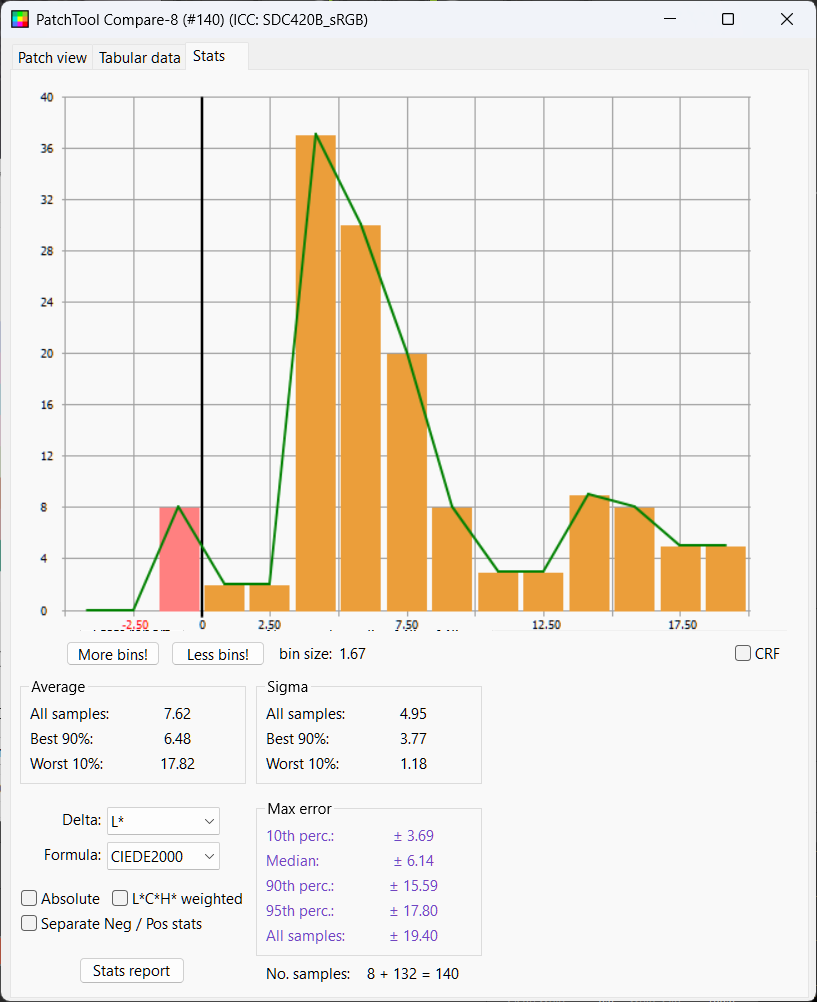
Results
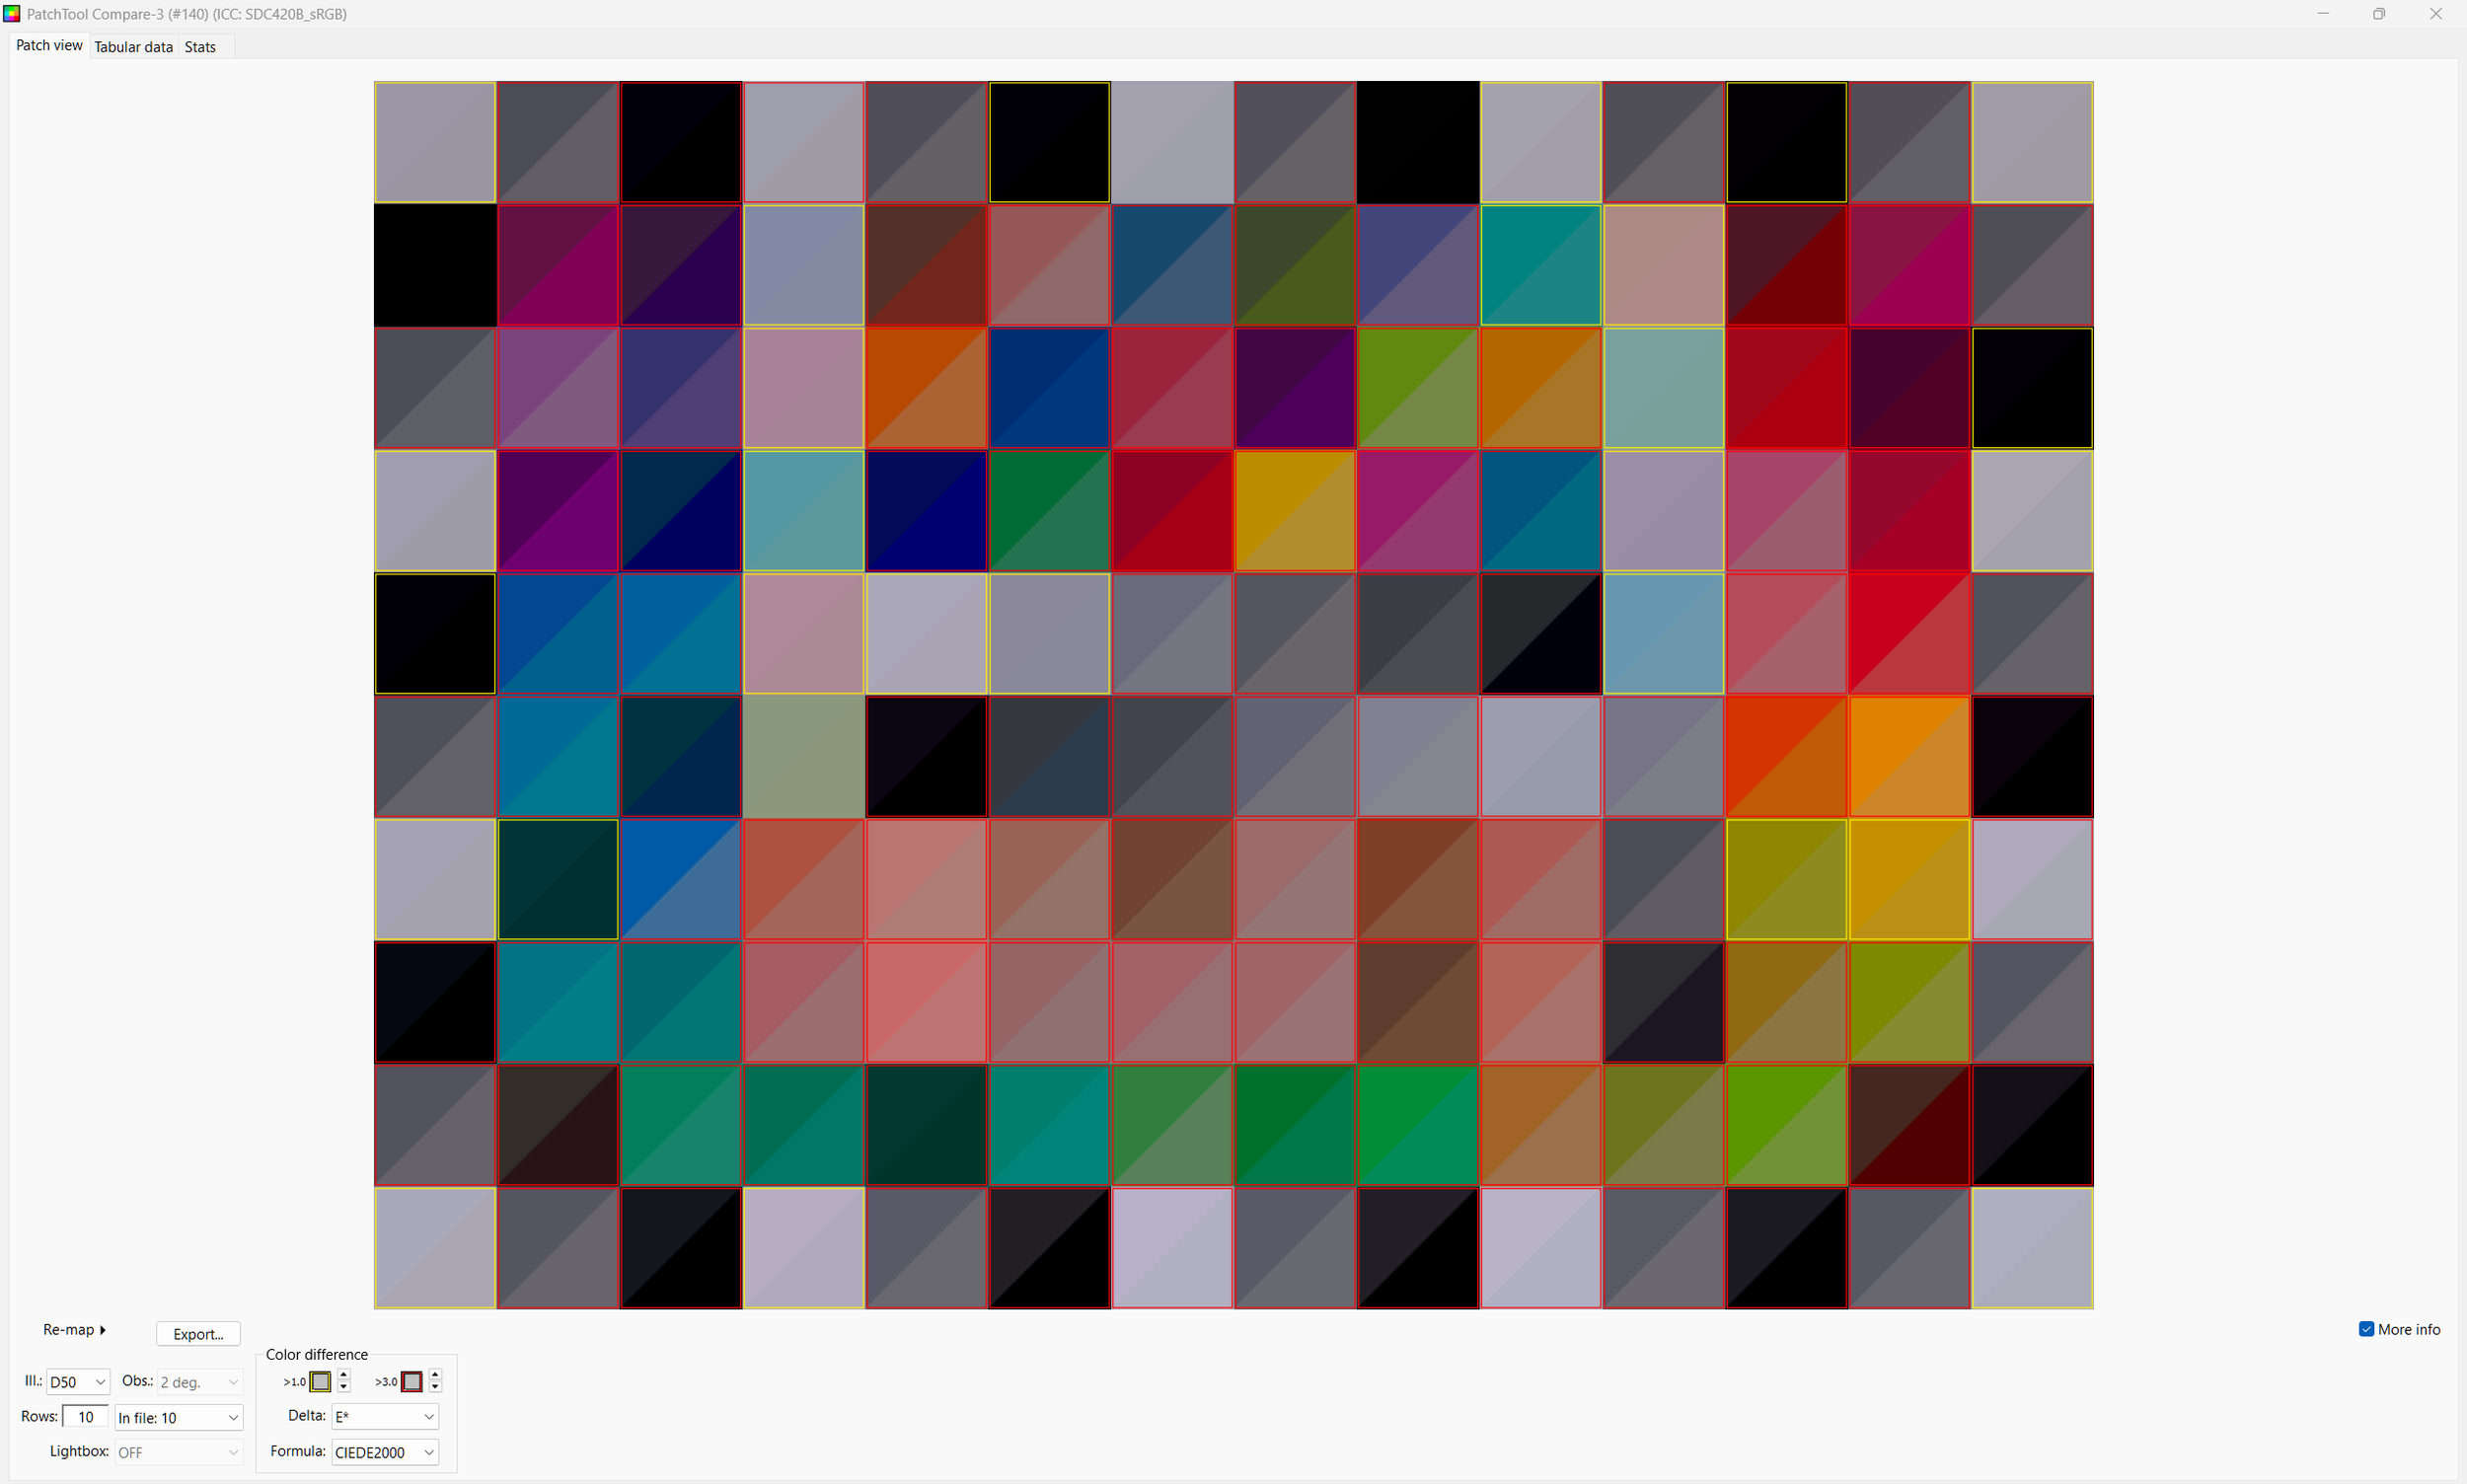
SOOC Results are very bad as expected. This is the comparison, top left half is what the chip should read per X-Rite, bottom right is the value we got from the camera. Chips with Red box have >5 delta E, yellow >1 delta E. Basically everything is red
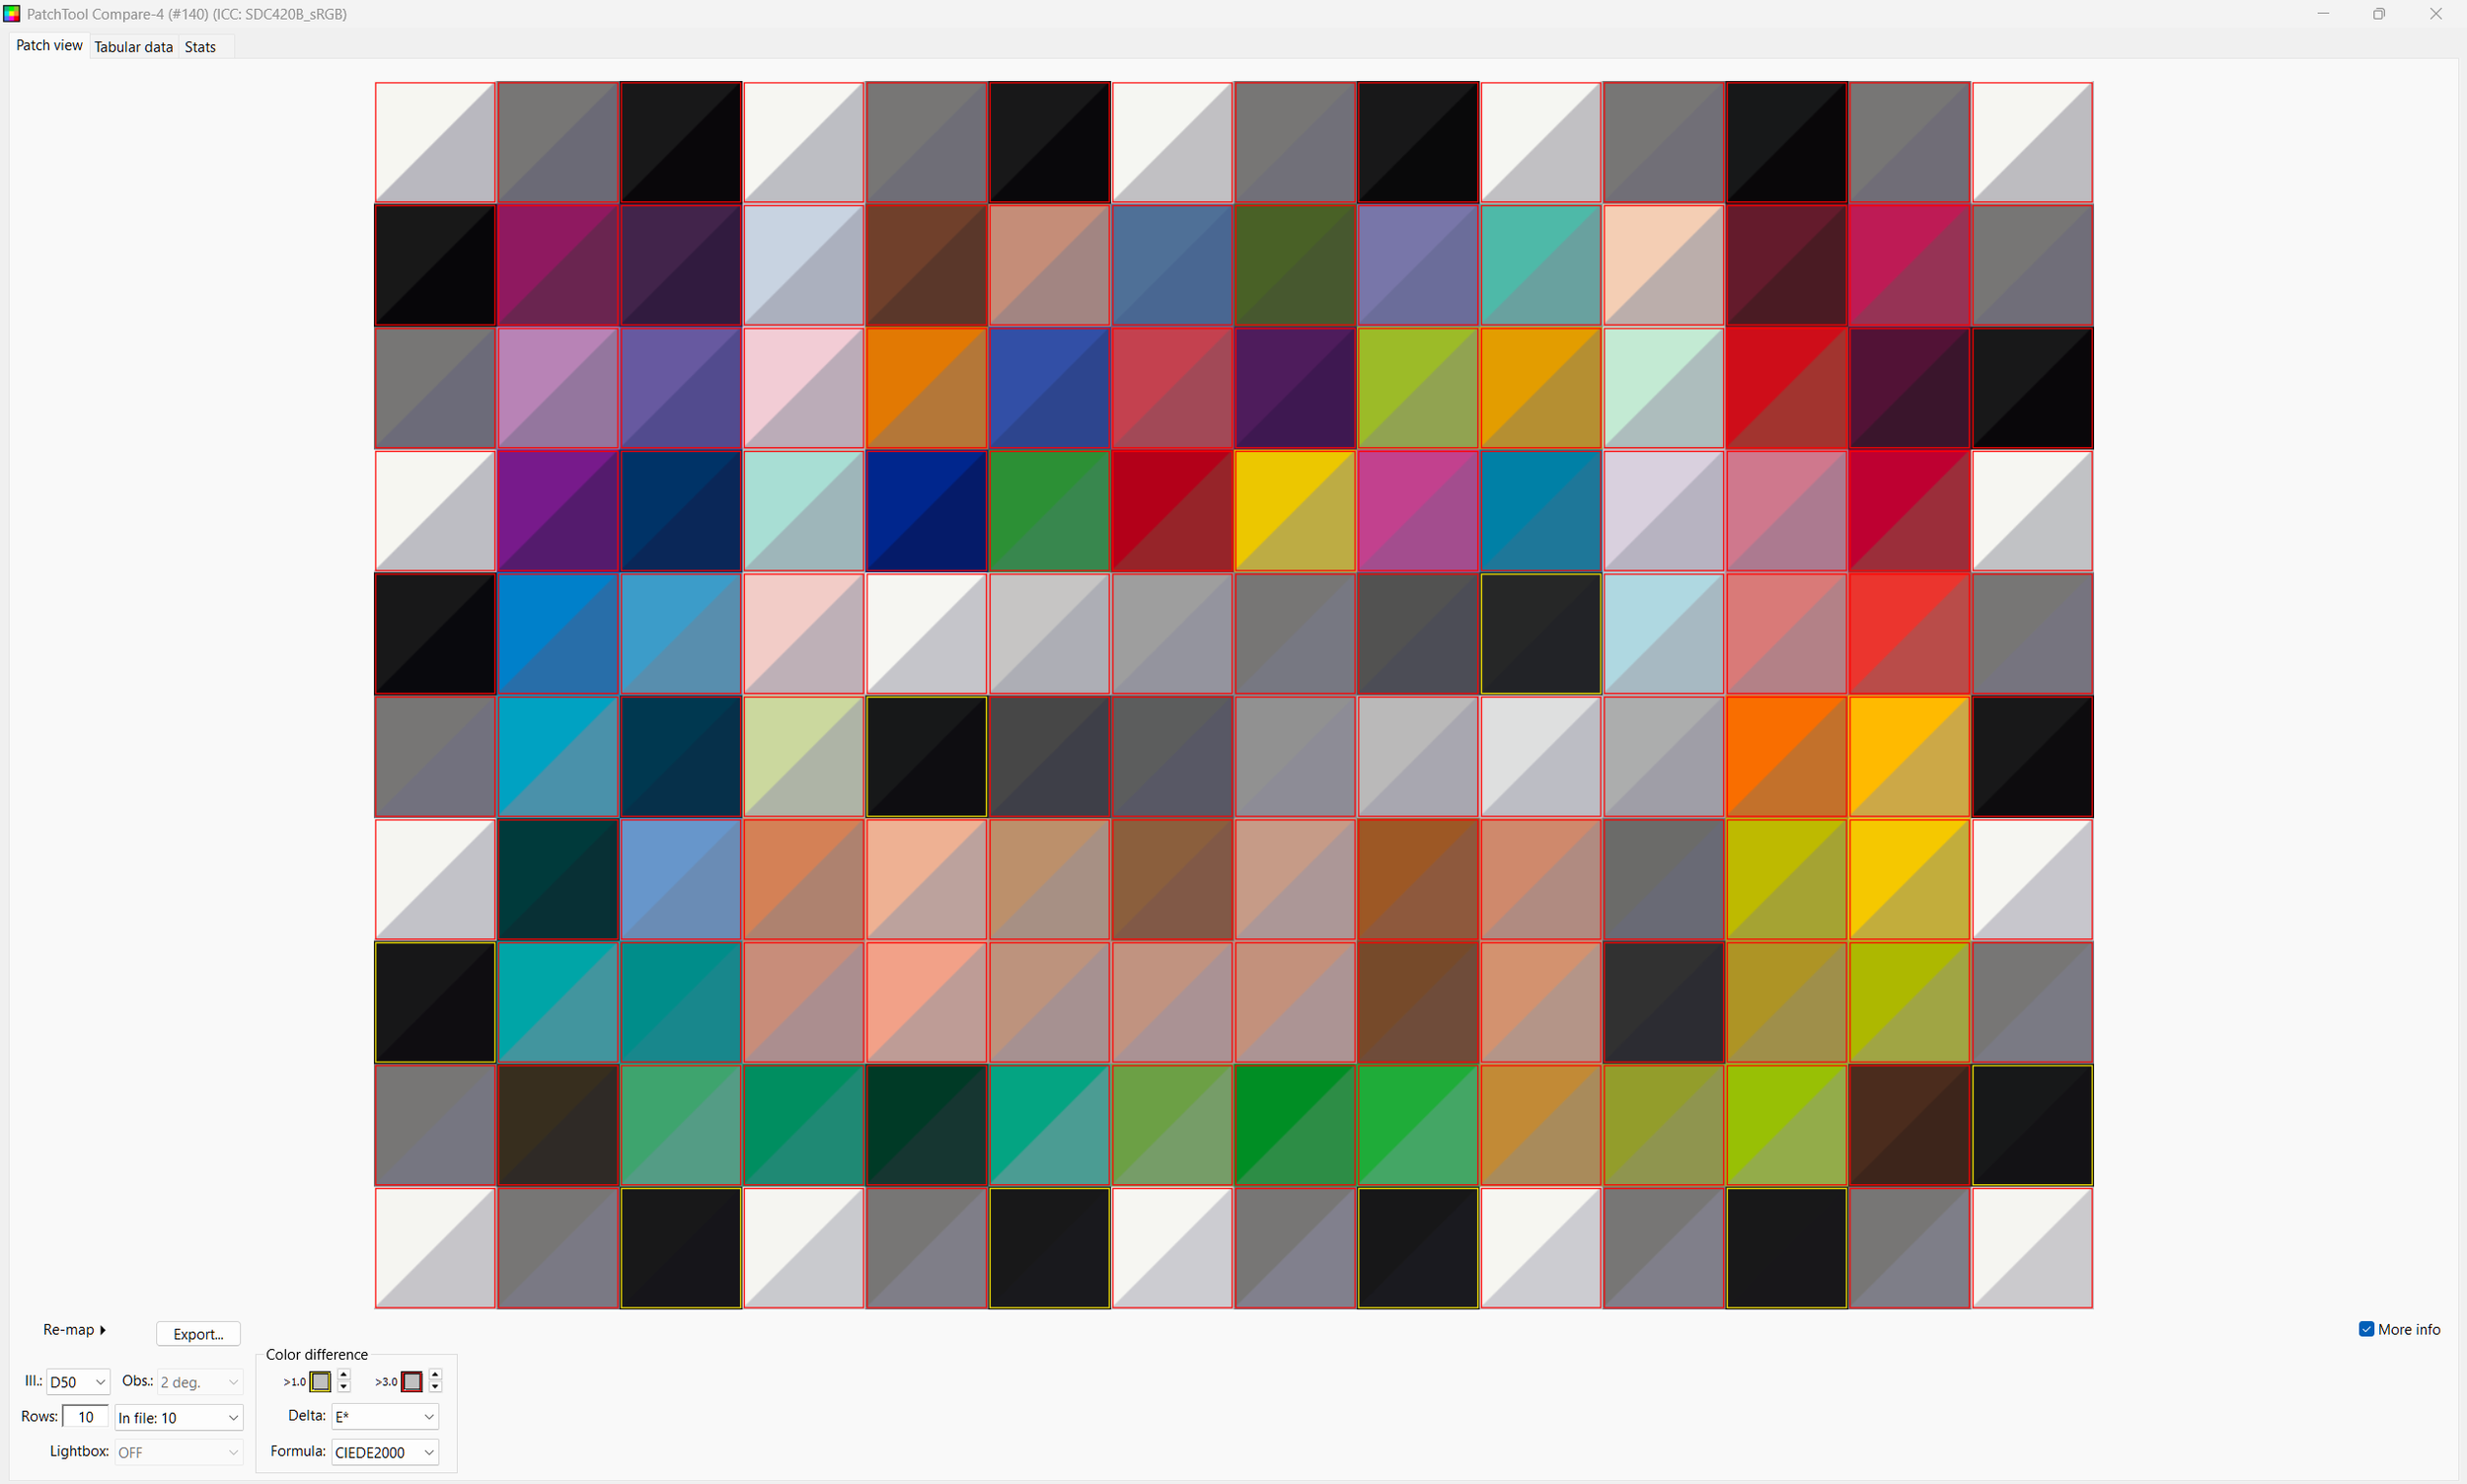
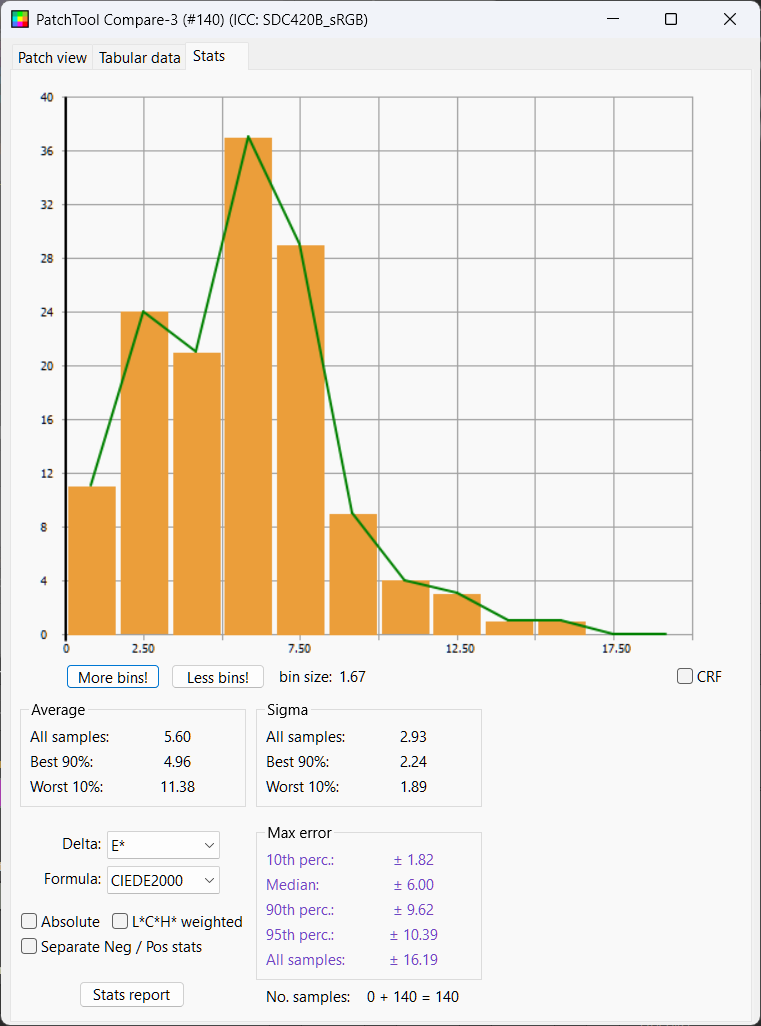
This is the histogram of delta E numbers, Mean is 7.91, Median 7.48
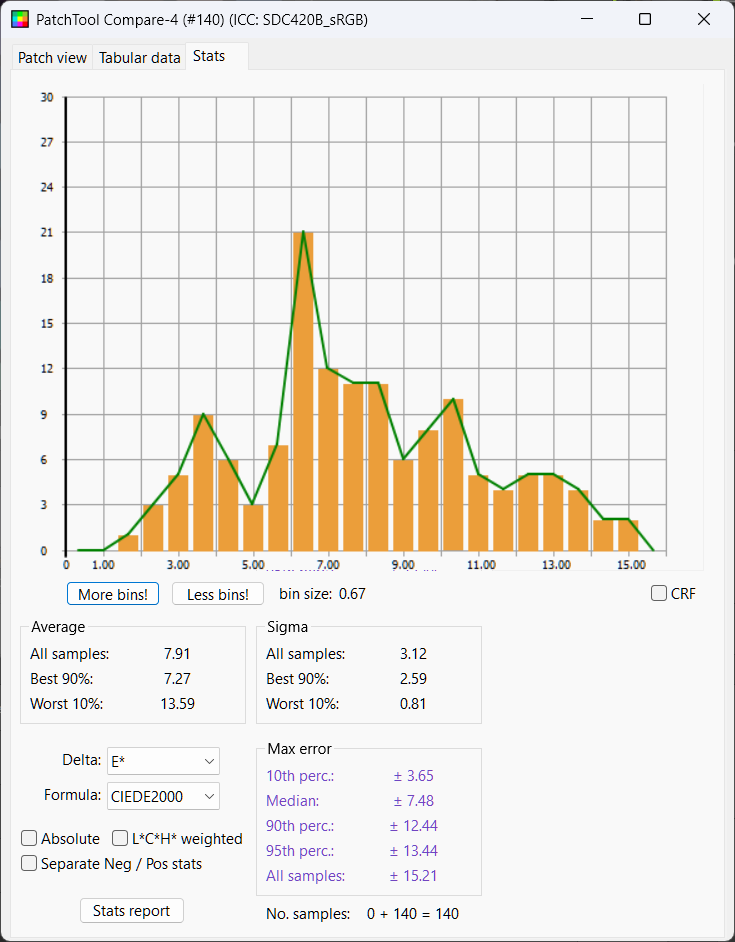
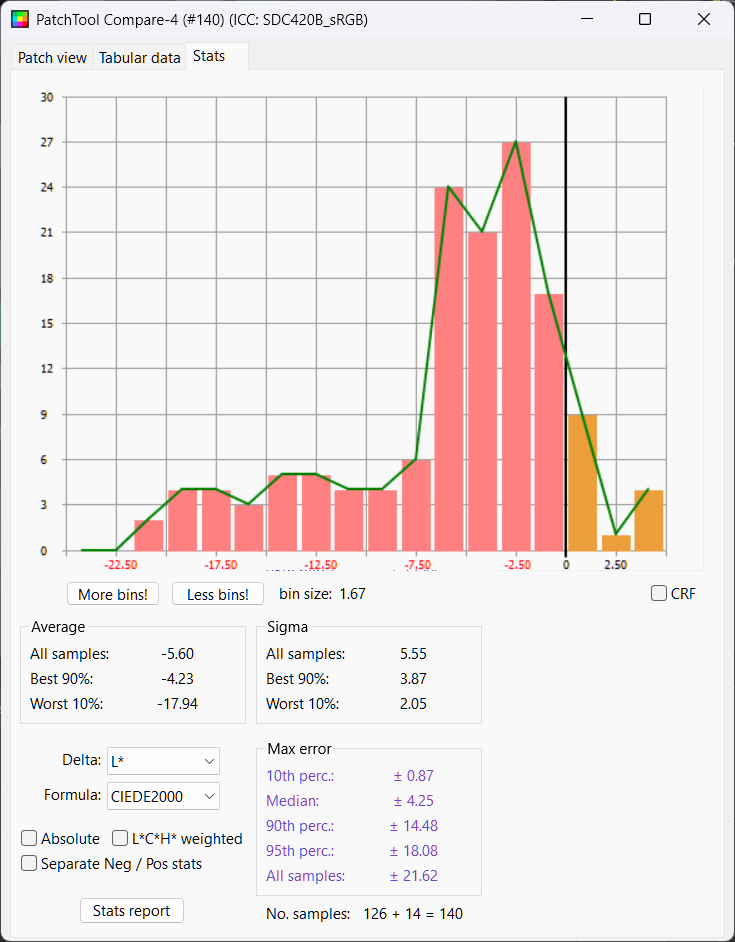
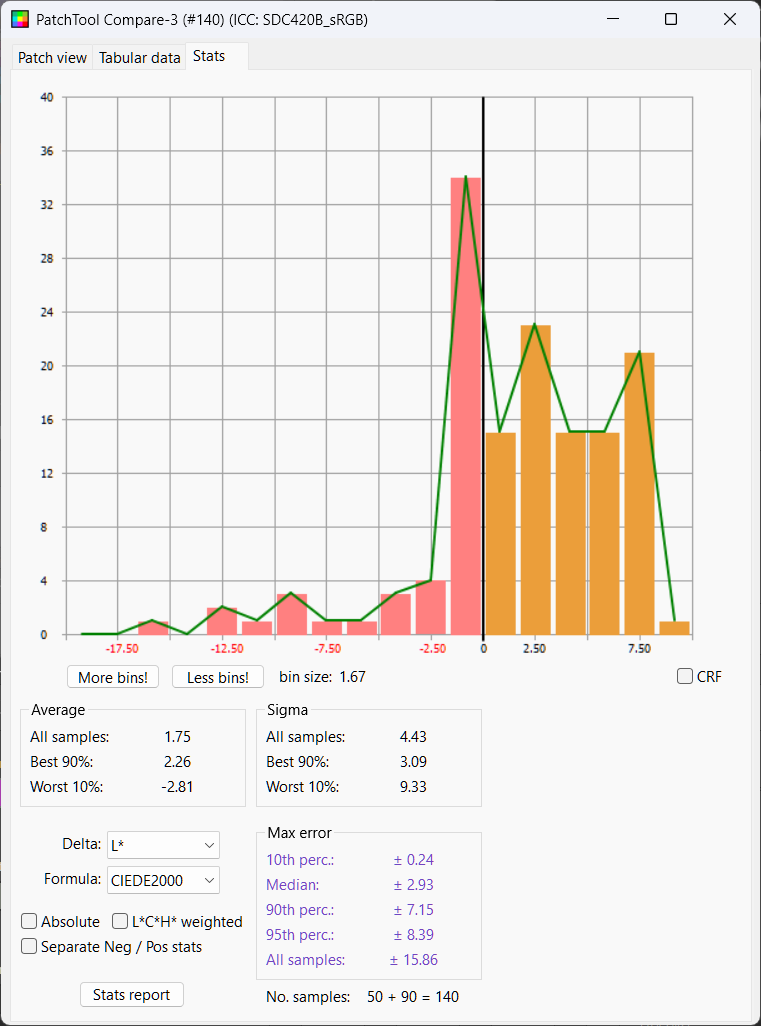
When you look at just the luminance error, you see despite the chart exposure being tweaked to middle grey matching reference, basically nothing else has correct luminance, most everything is too dark. Half the chips are within a delta L of 4.25.
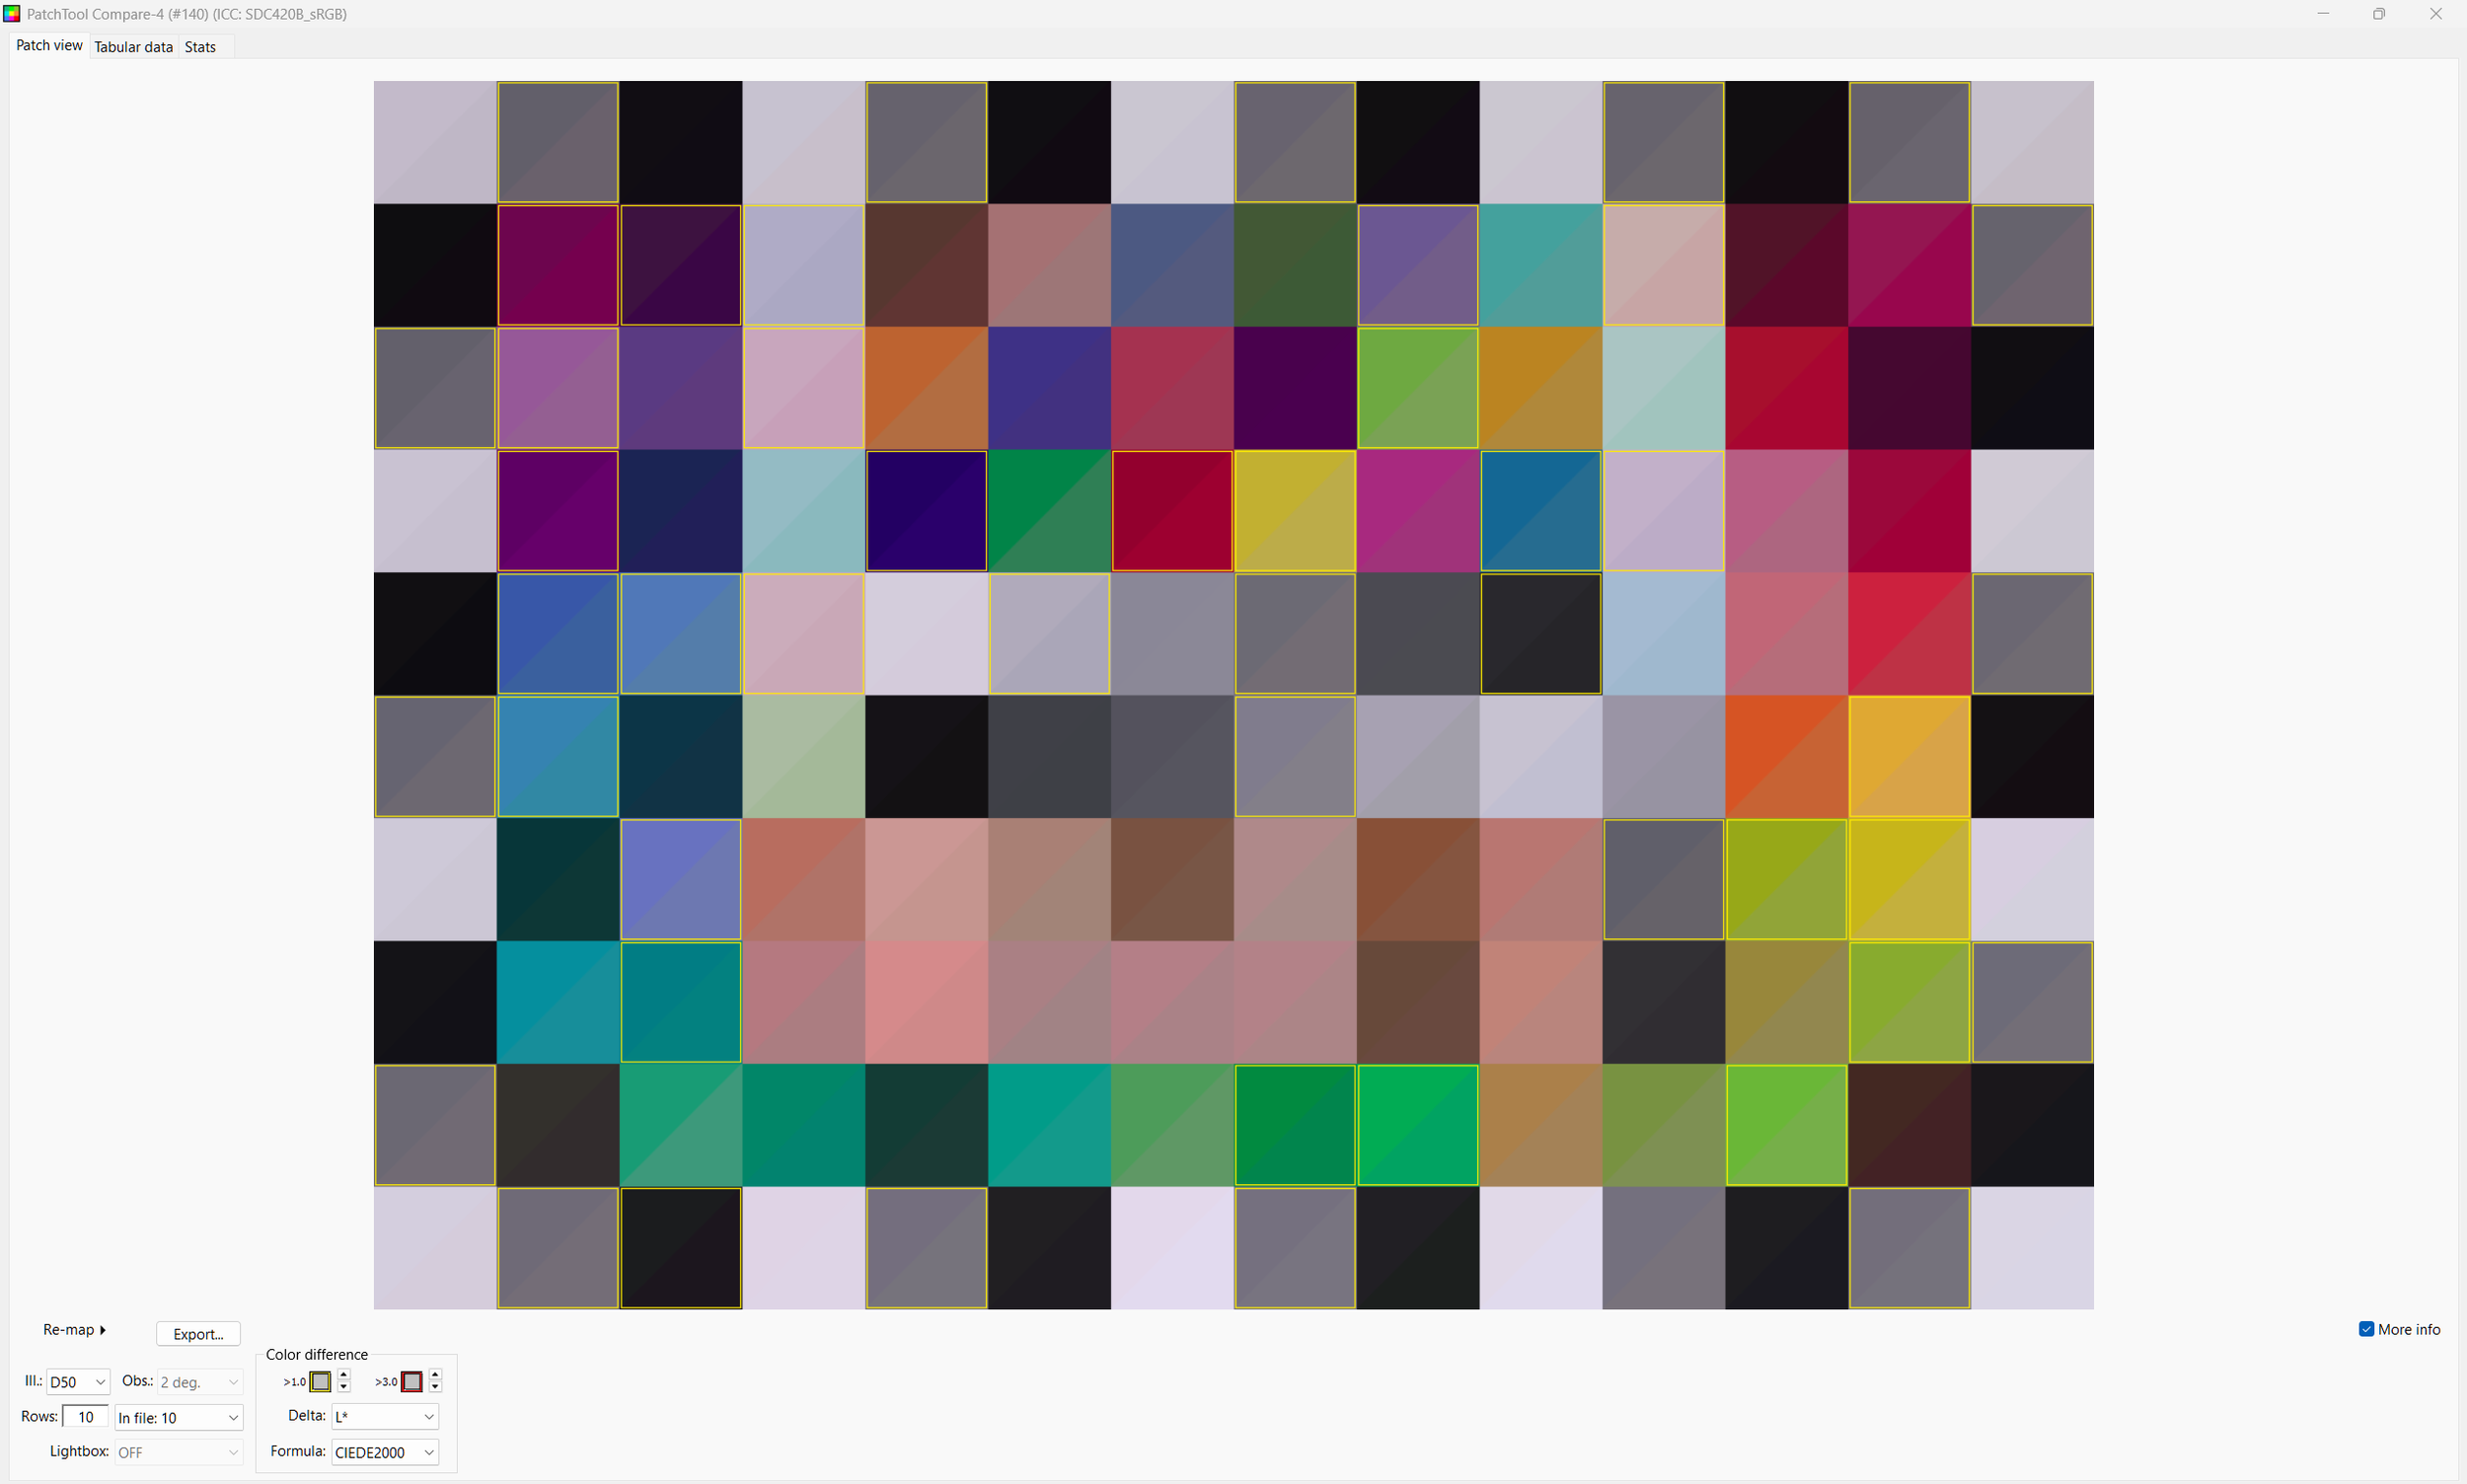
These are the results for the DJI free LUT
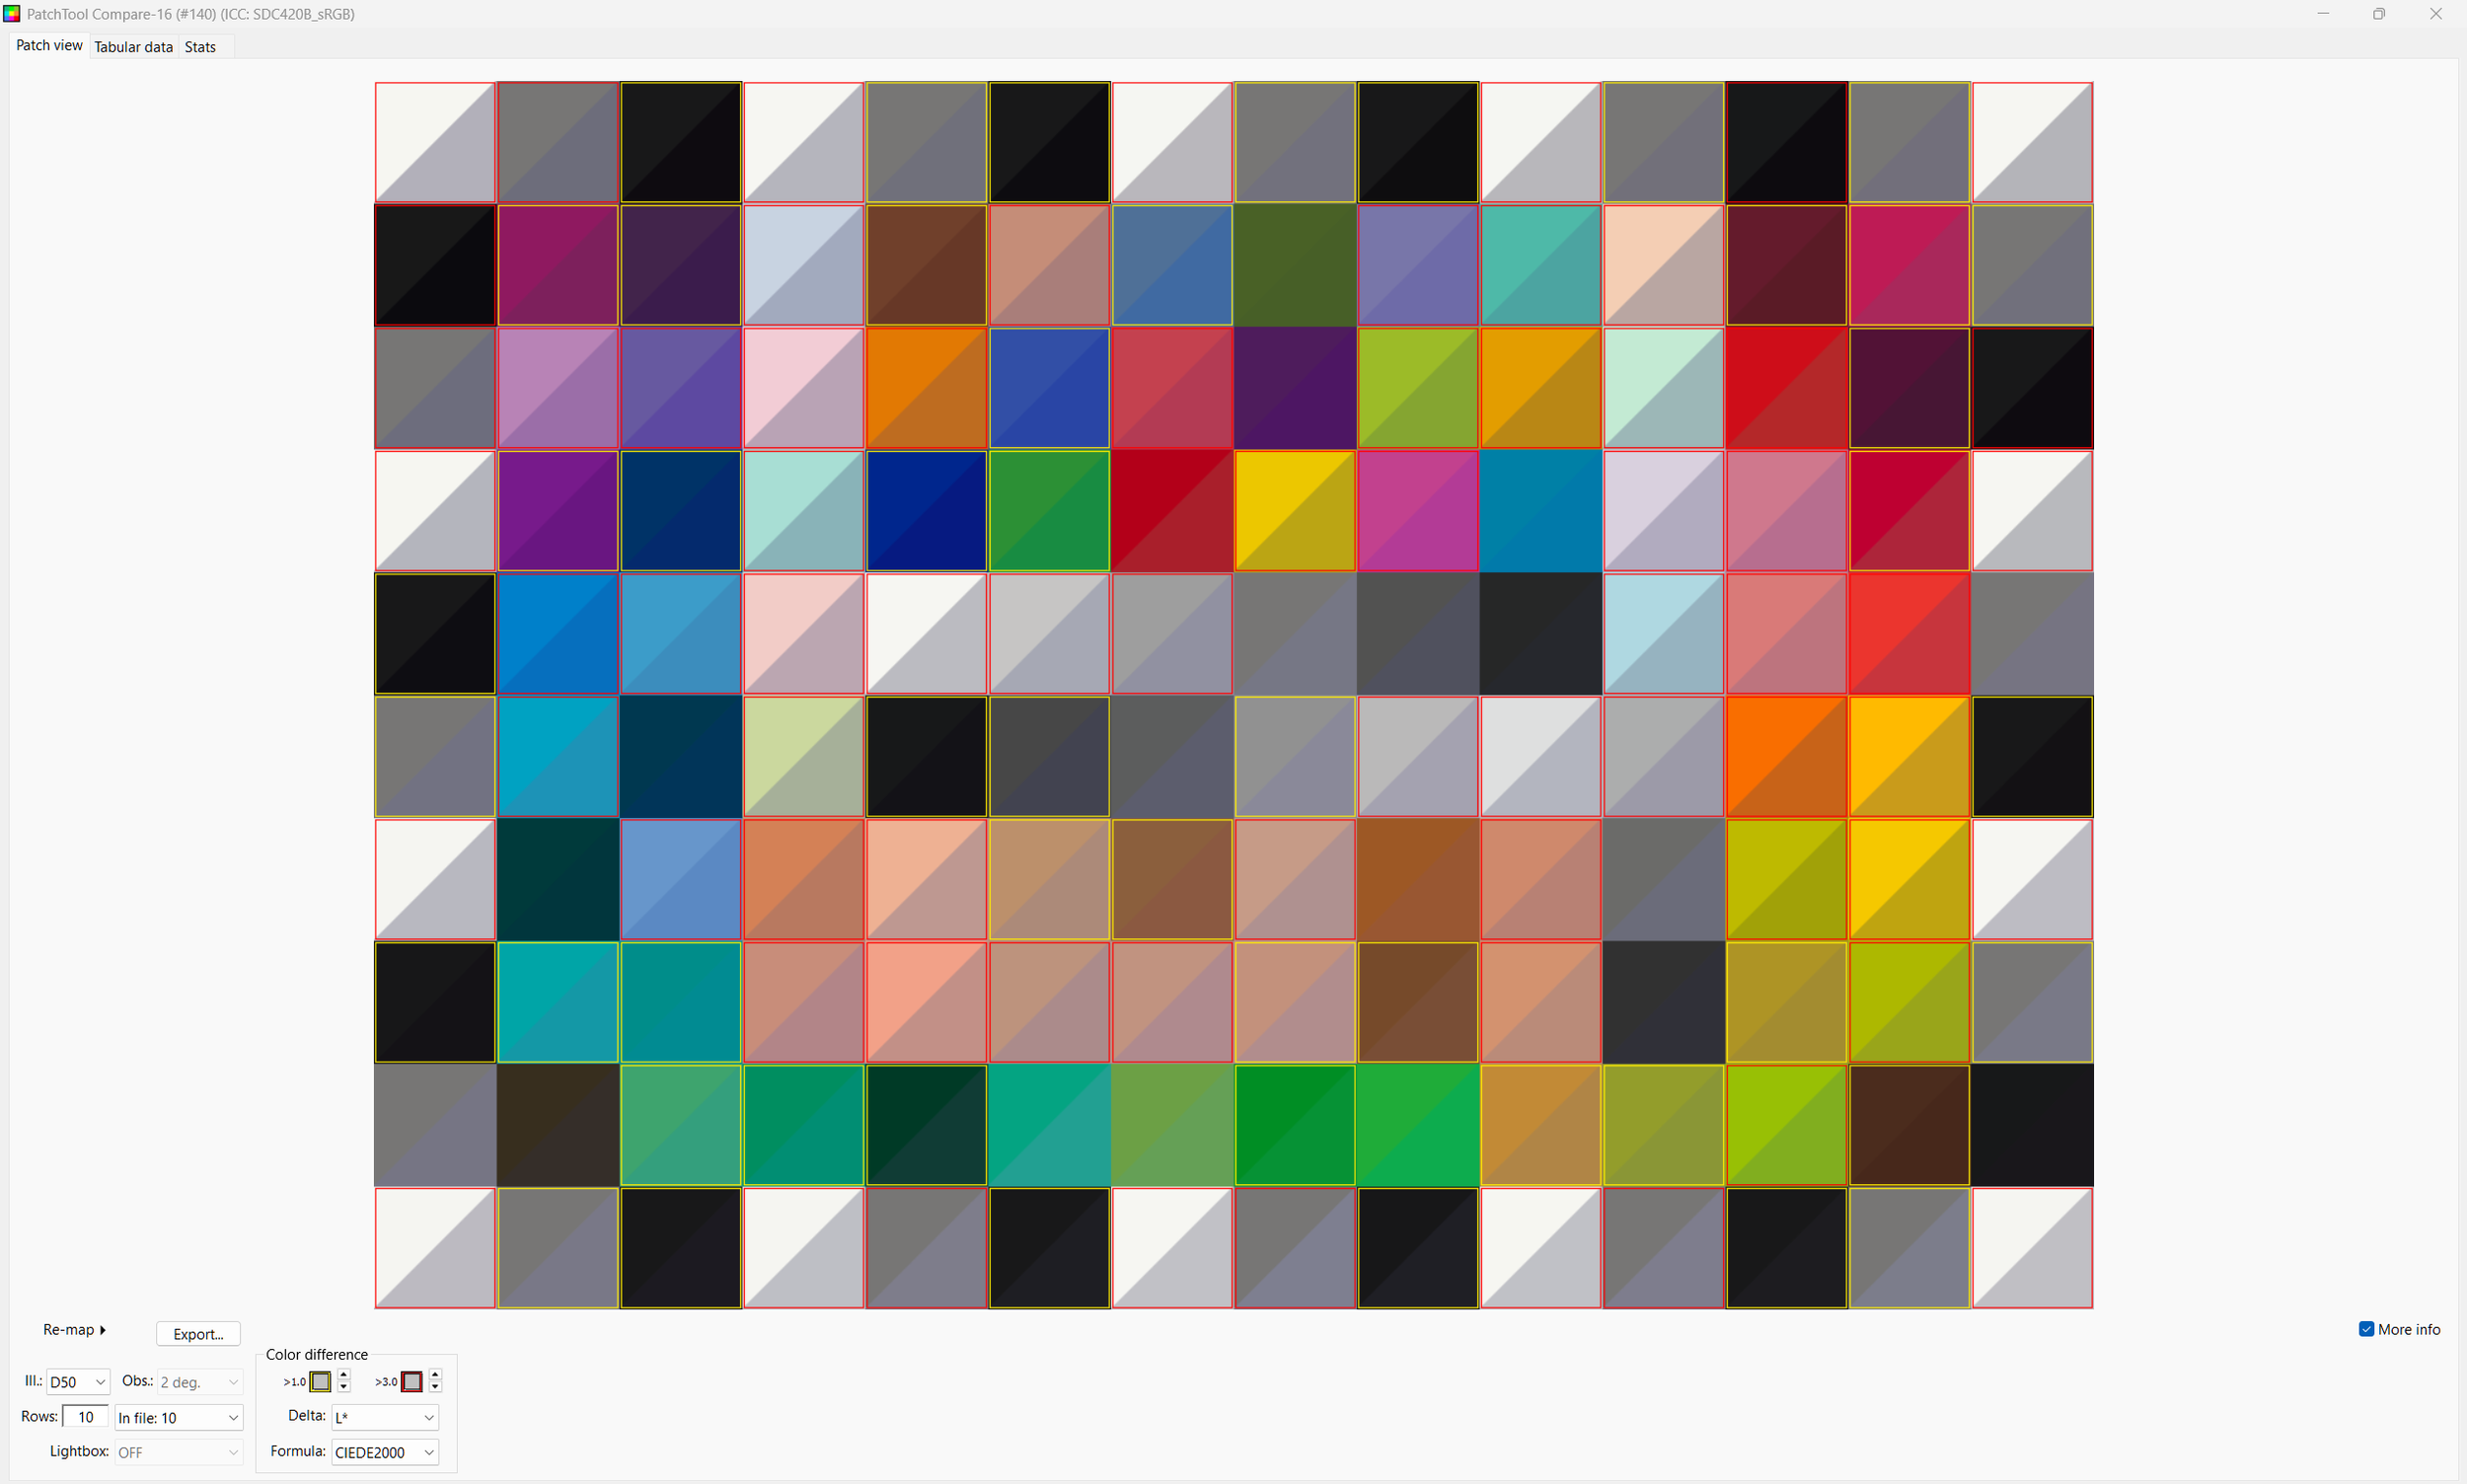
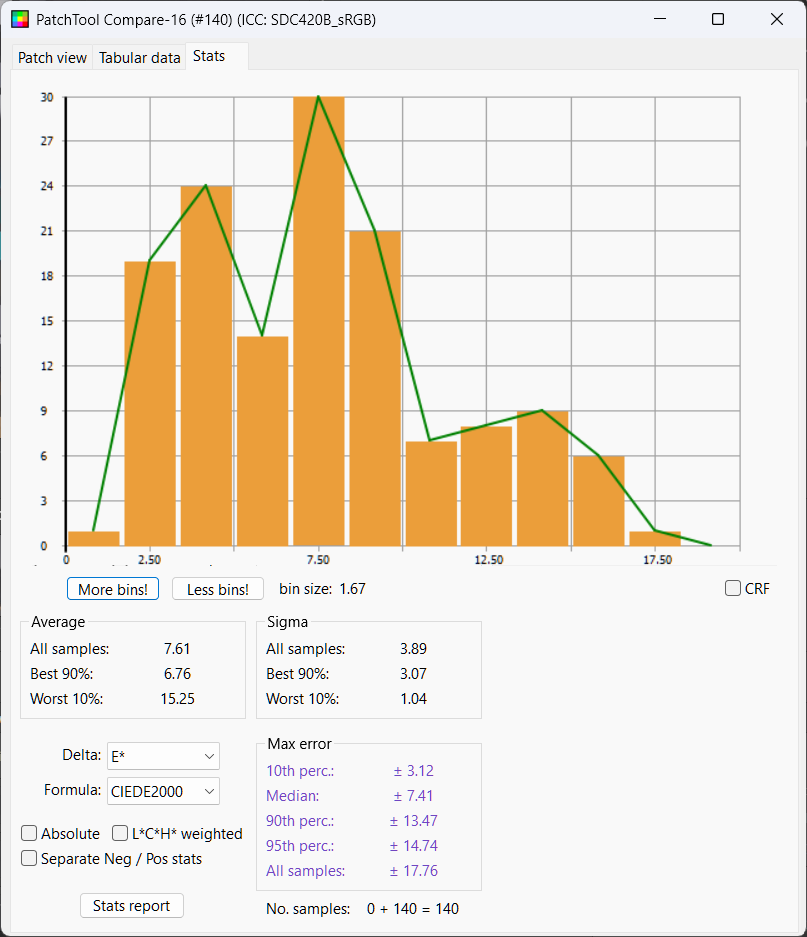
We see the whites are not nearly bright enough. Looking at Delta L chart we see again most chips are too dark and half the chips within delta L of 3.64. Mean Delta E is 7.61, median 7.41, not much better than no color management at all
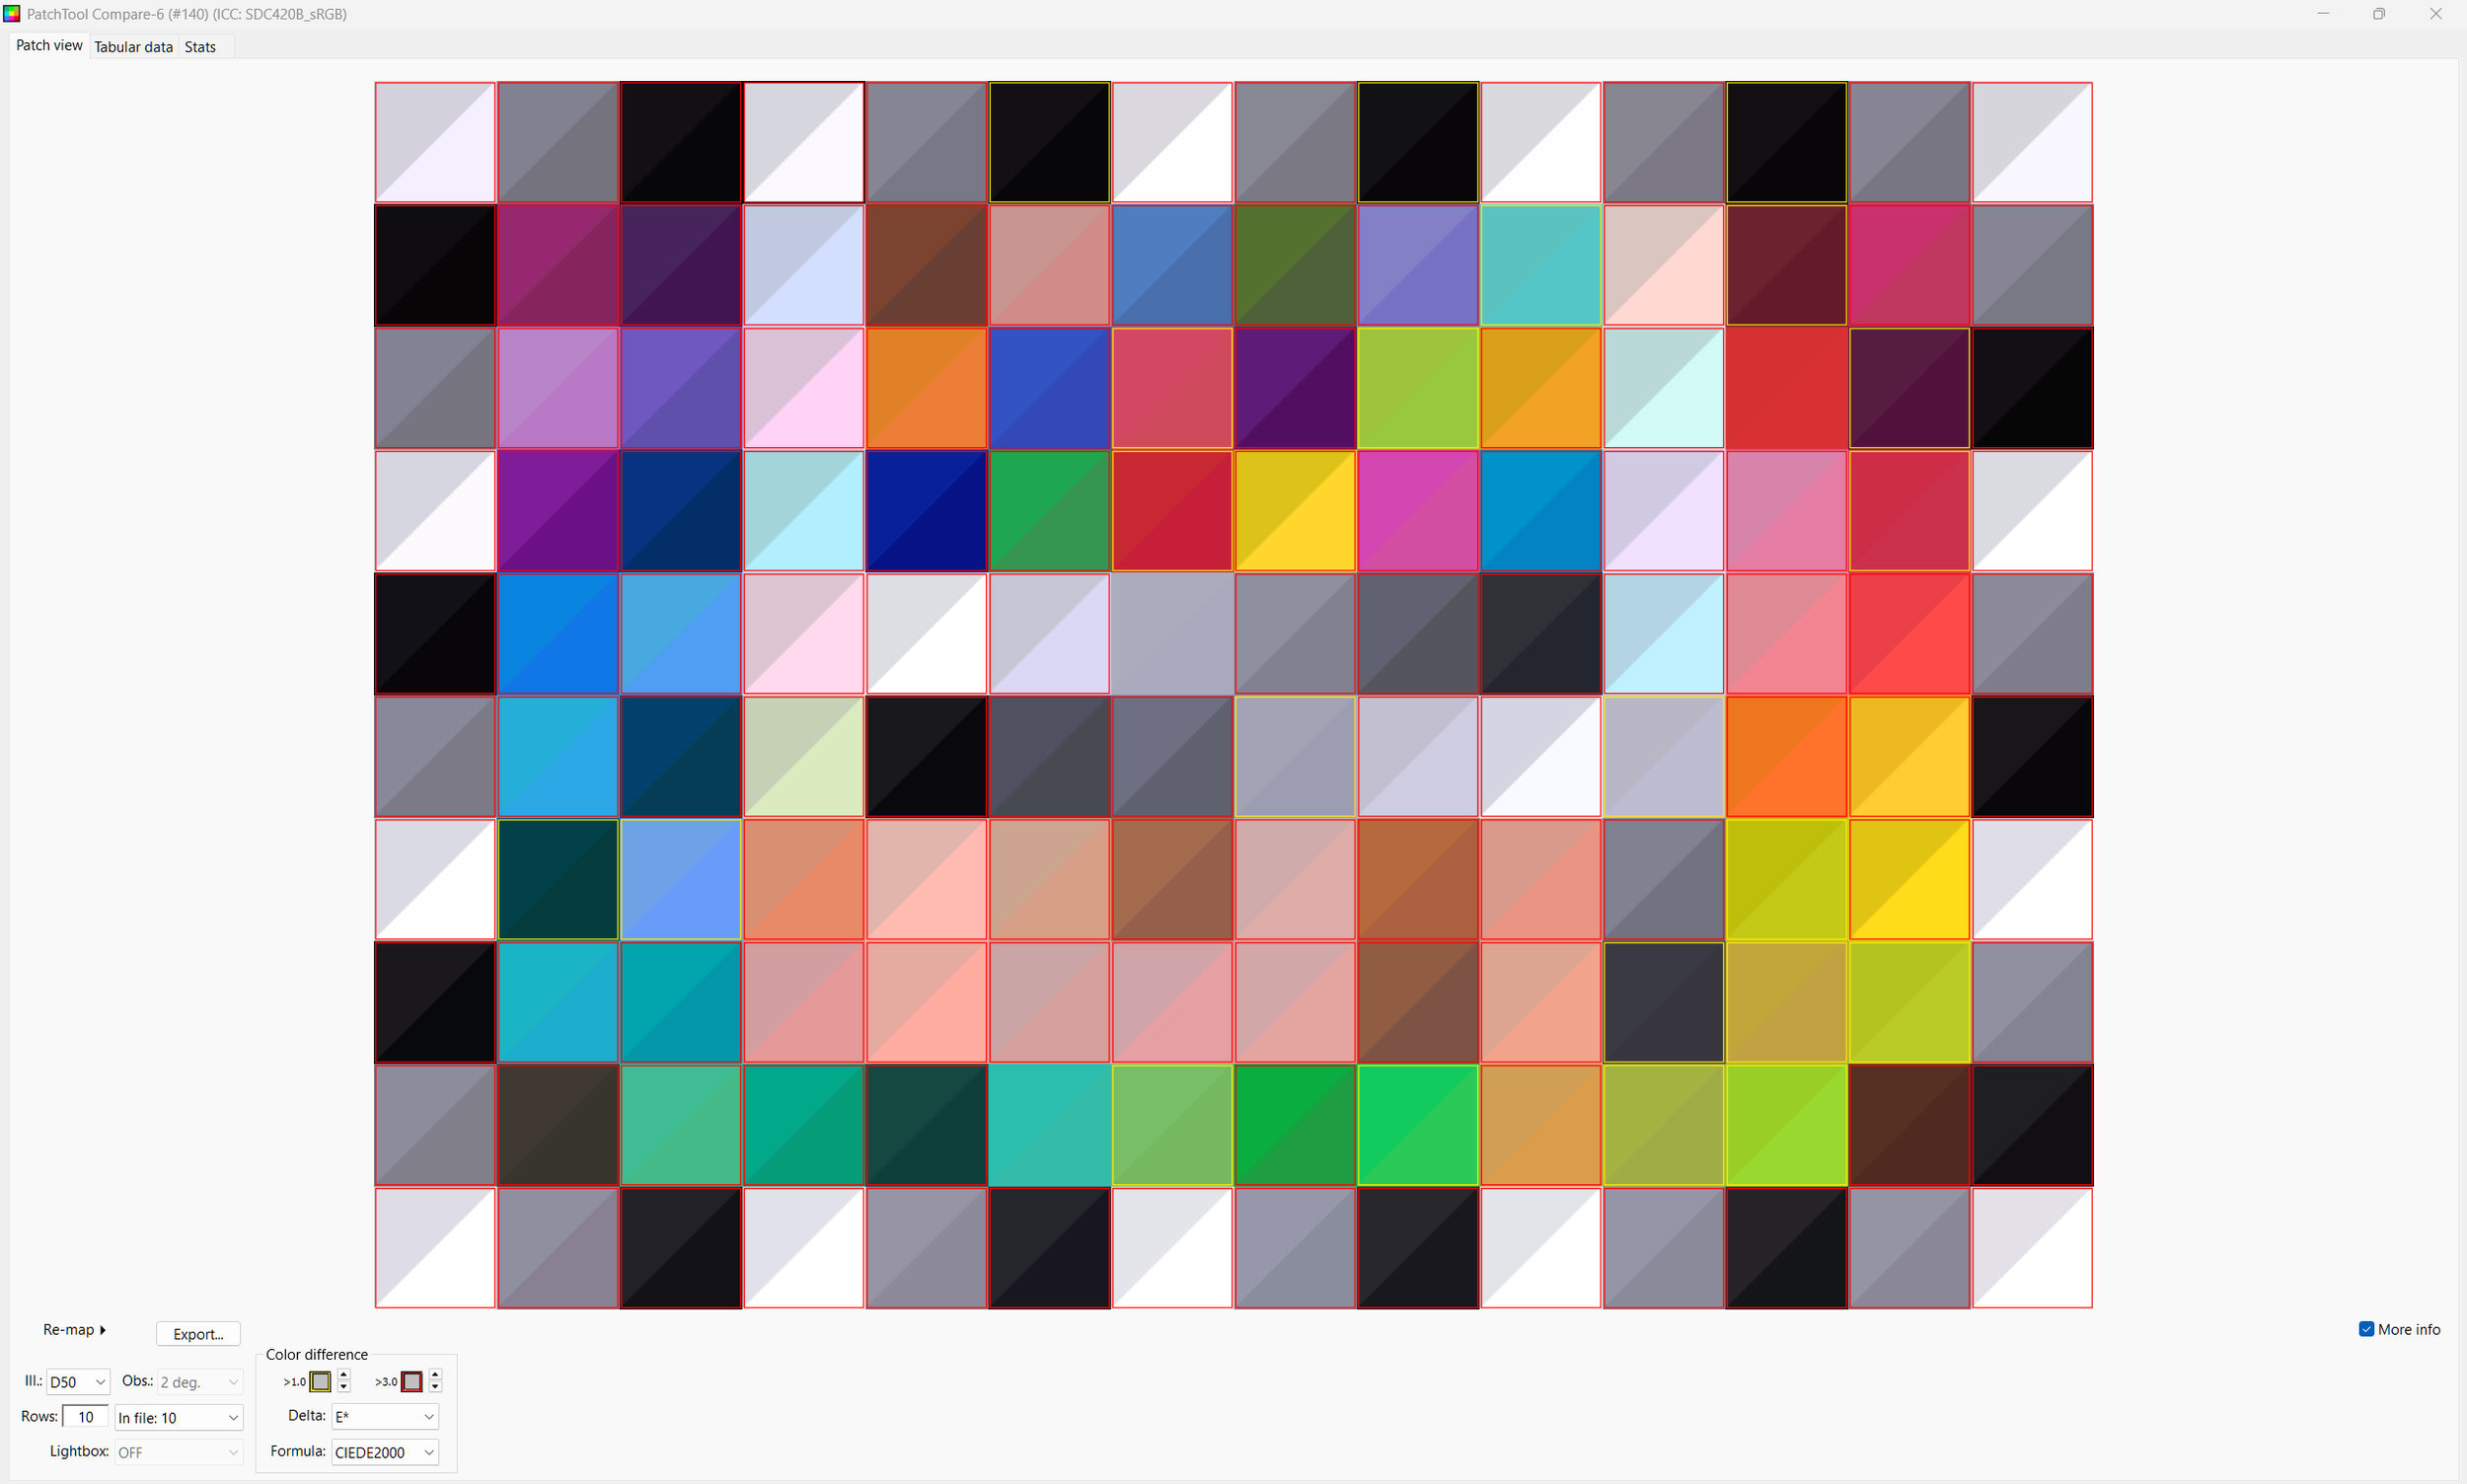
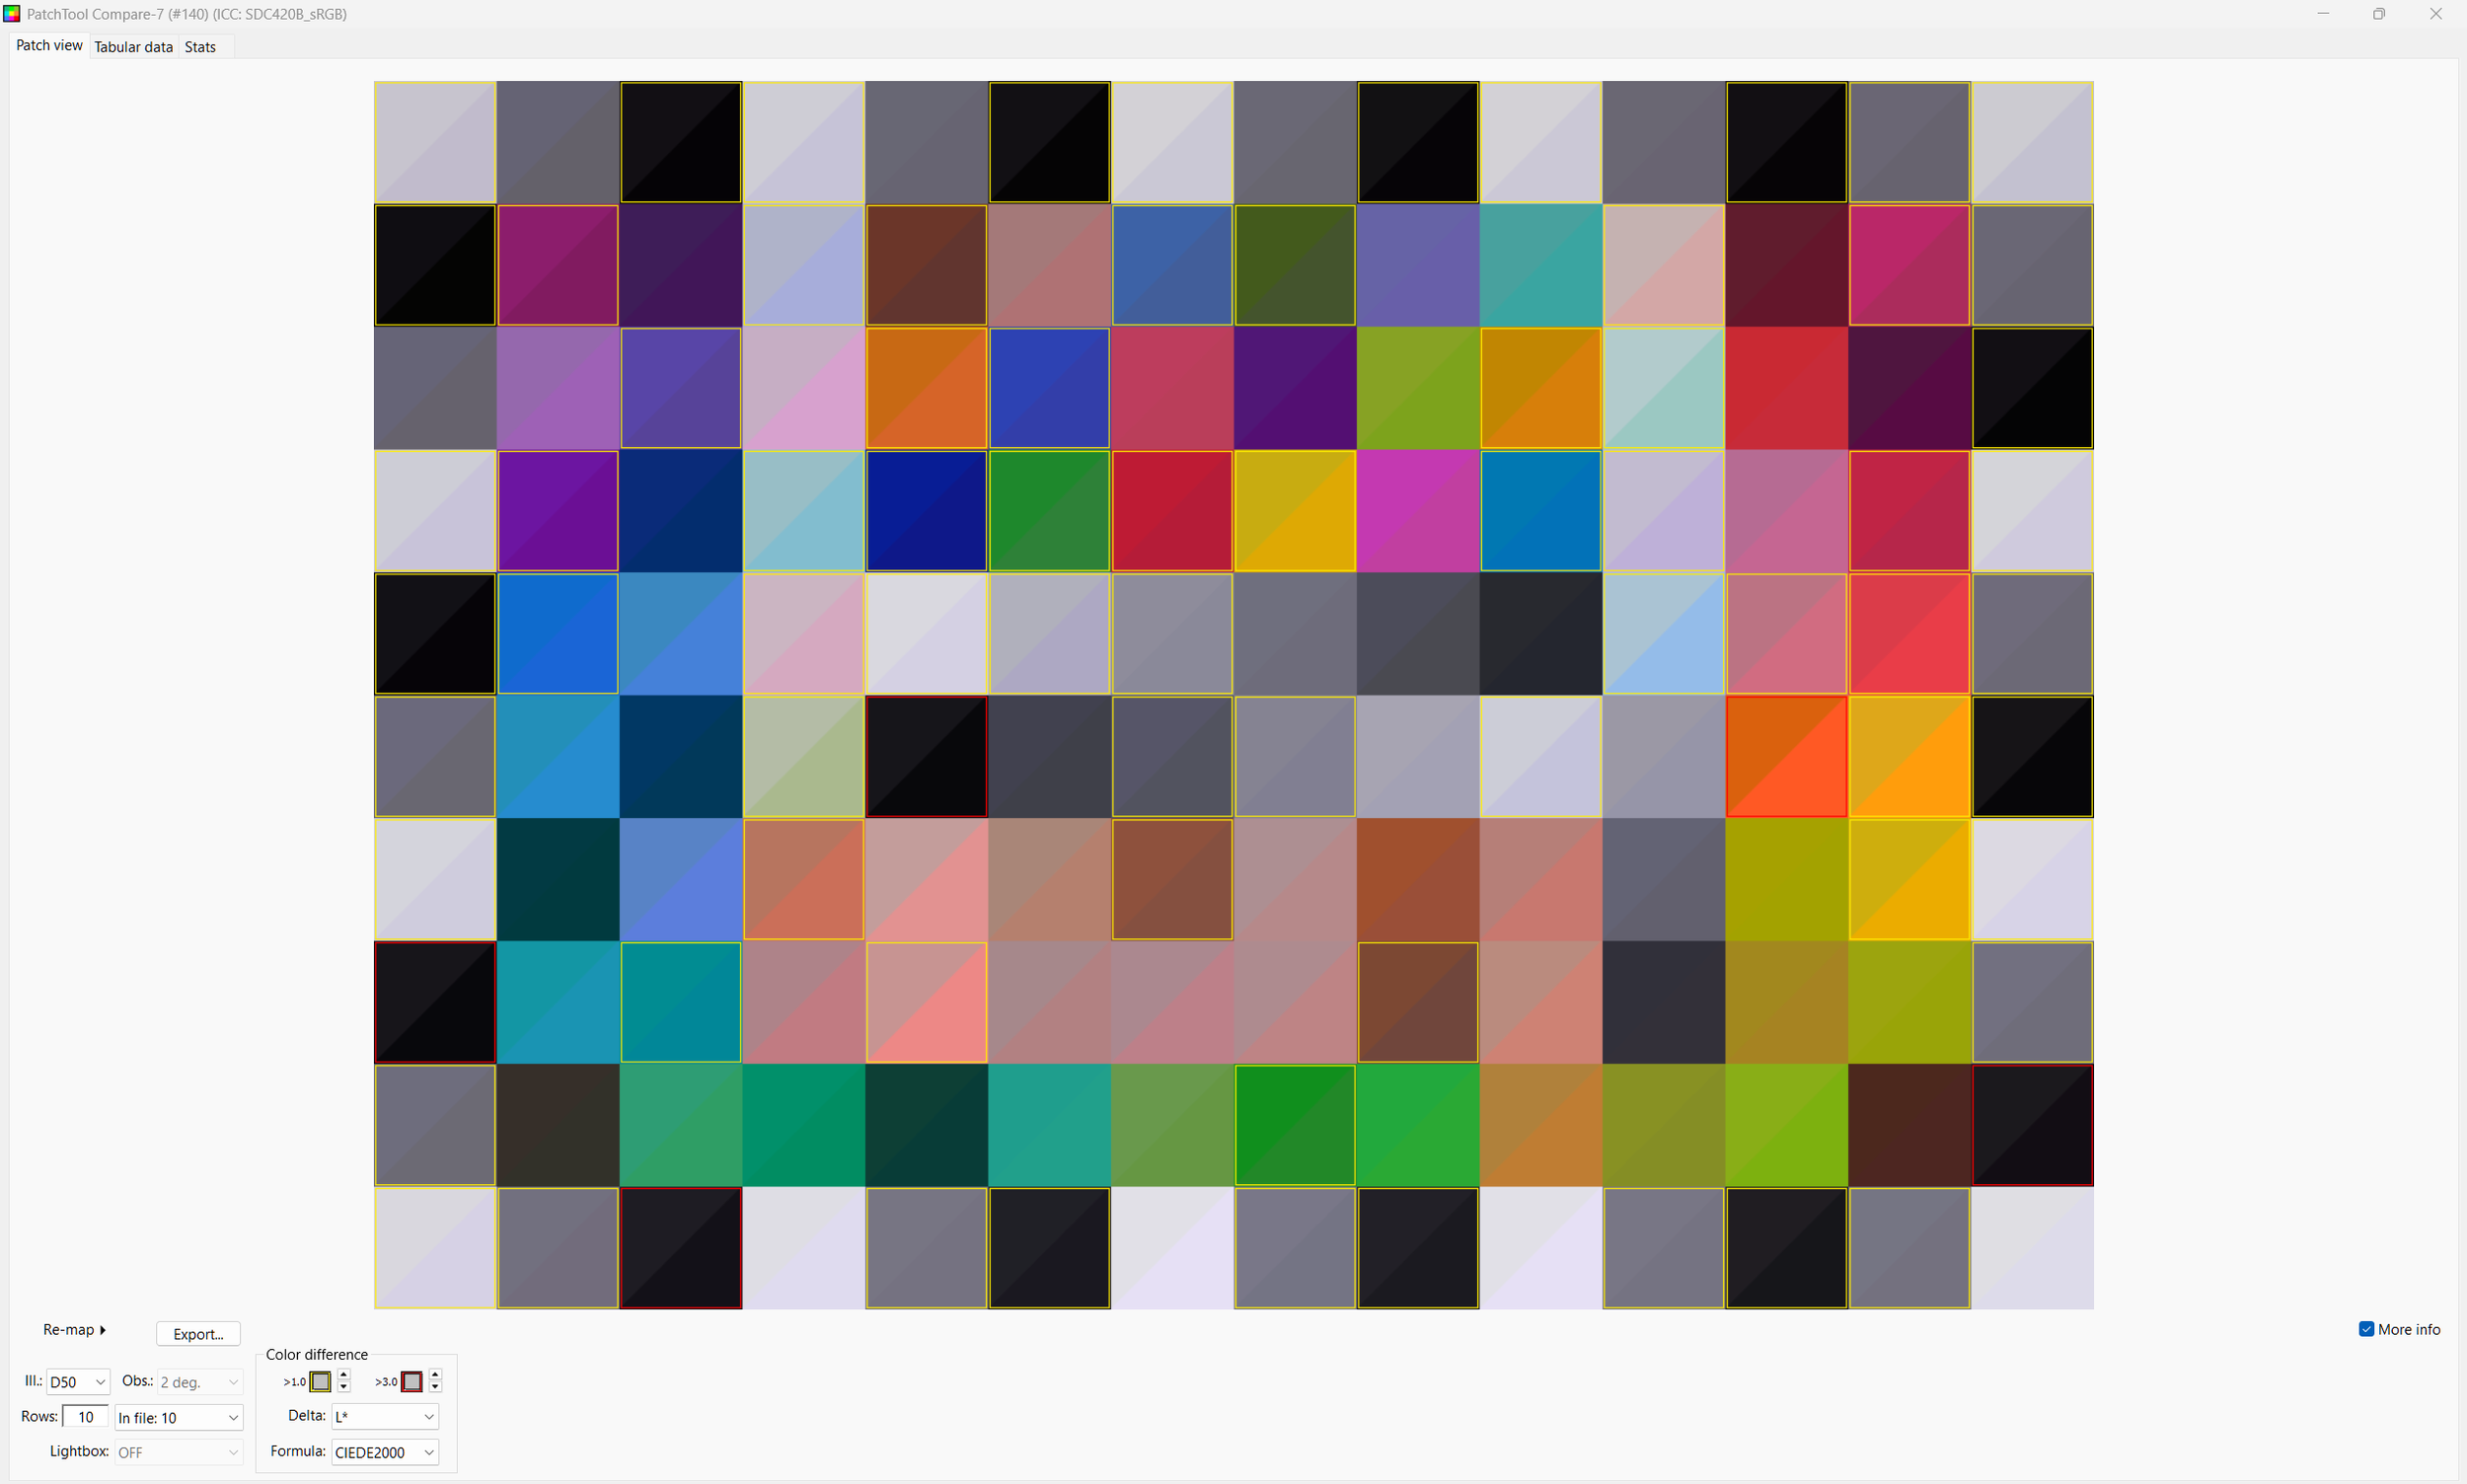
My original power grade shows the following results;
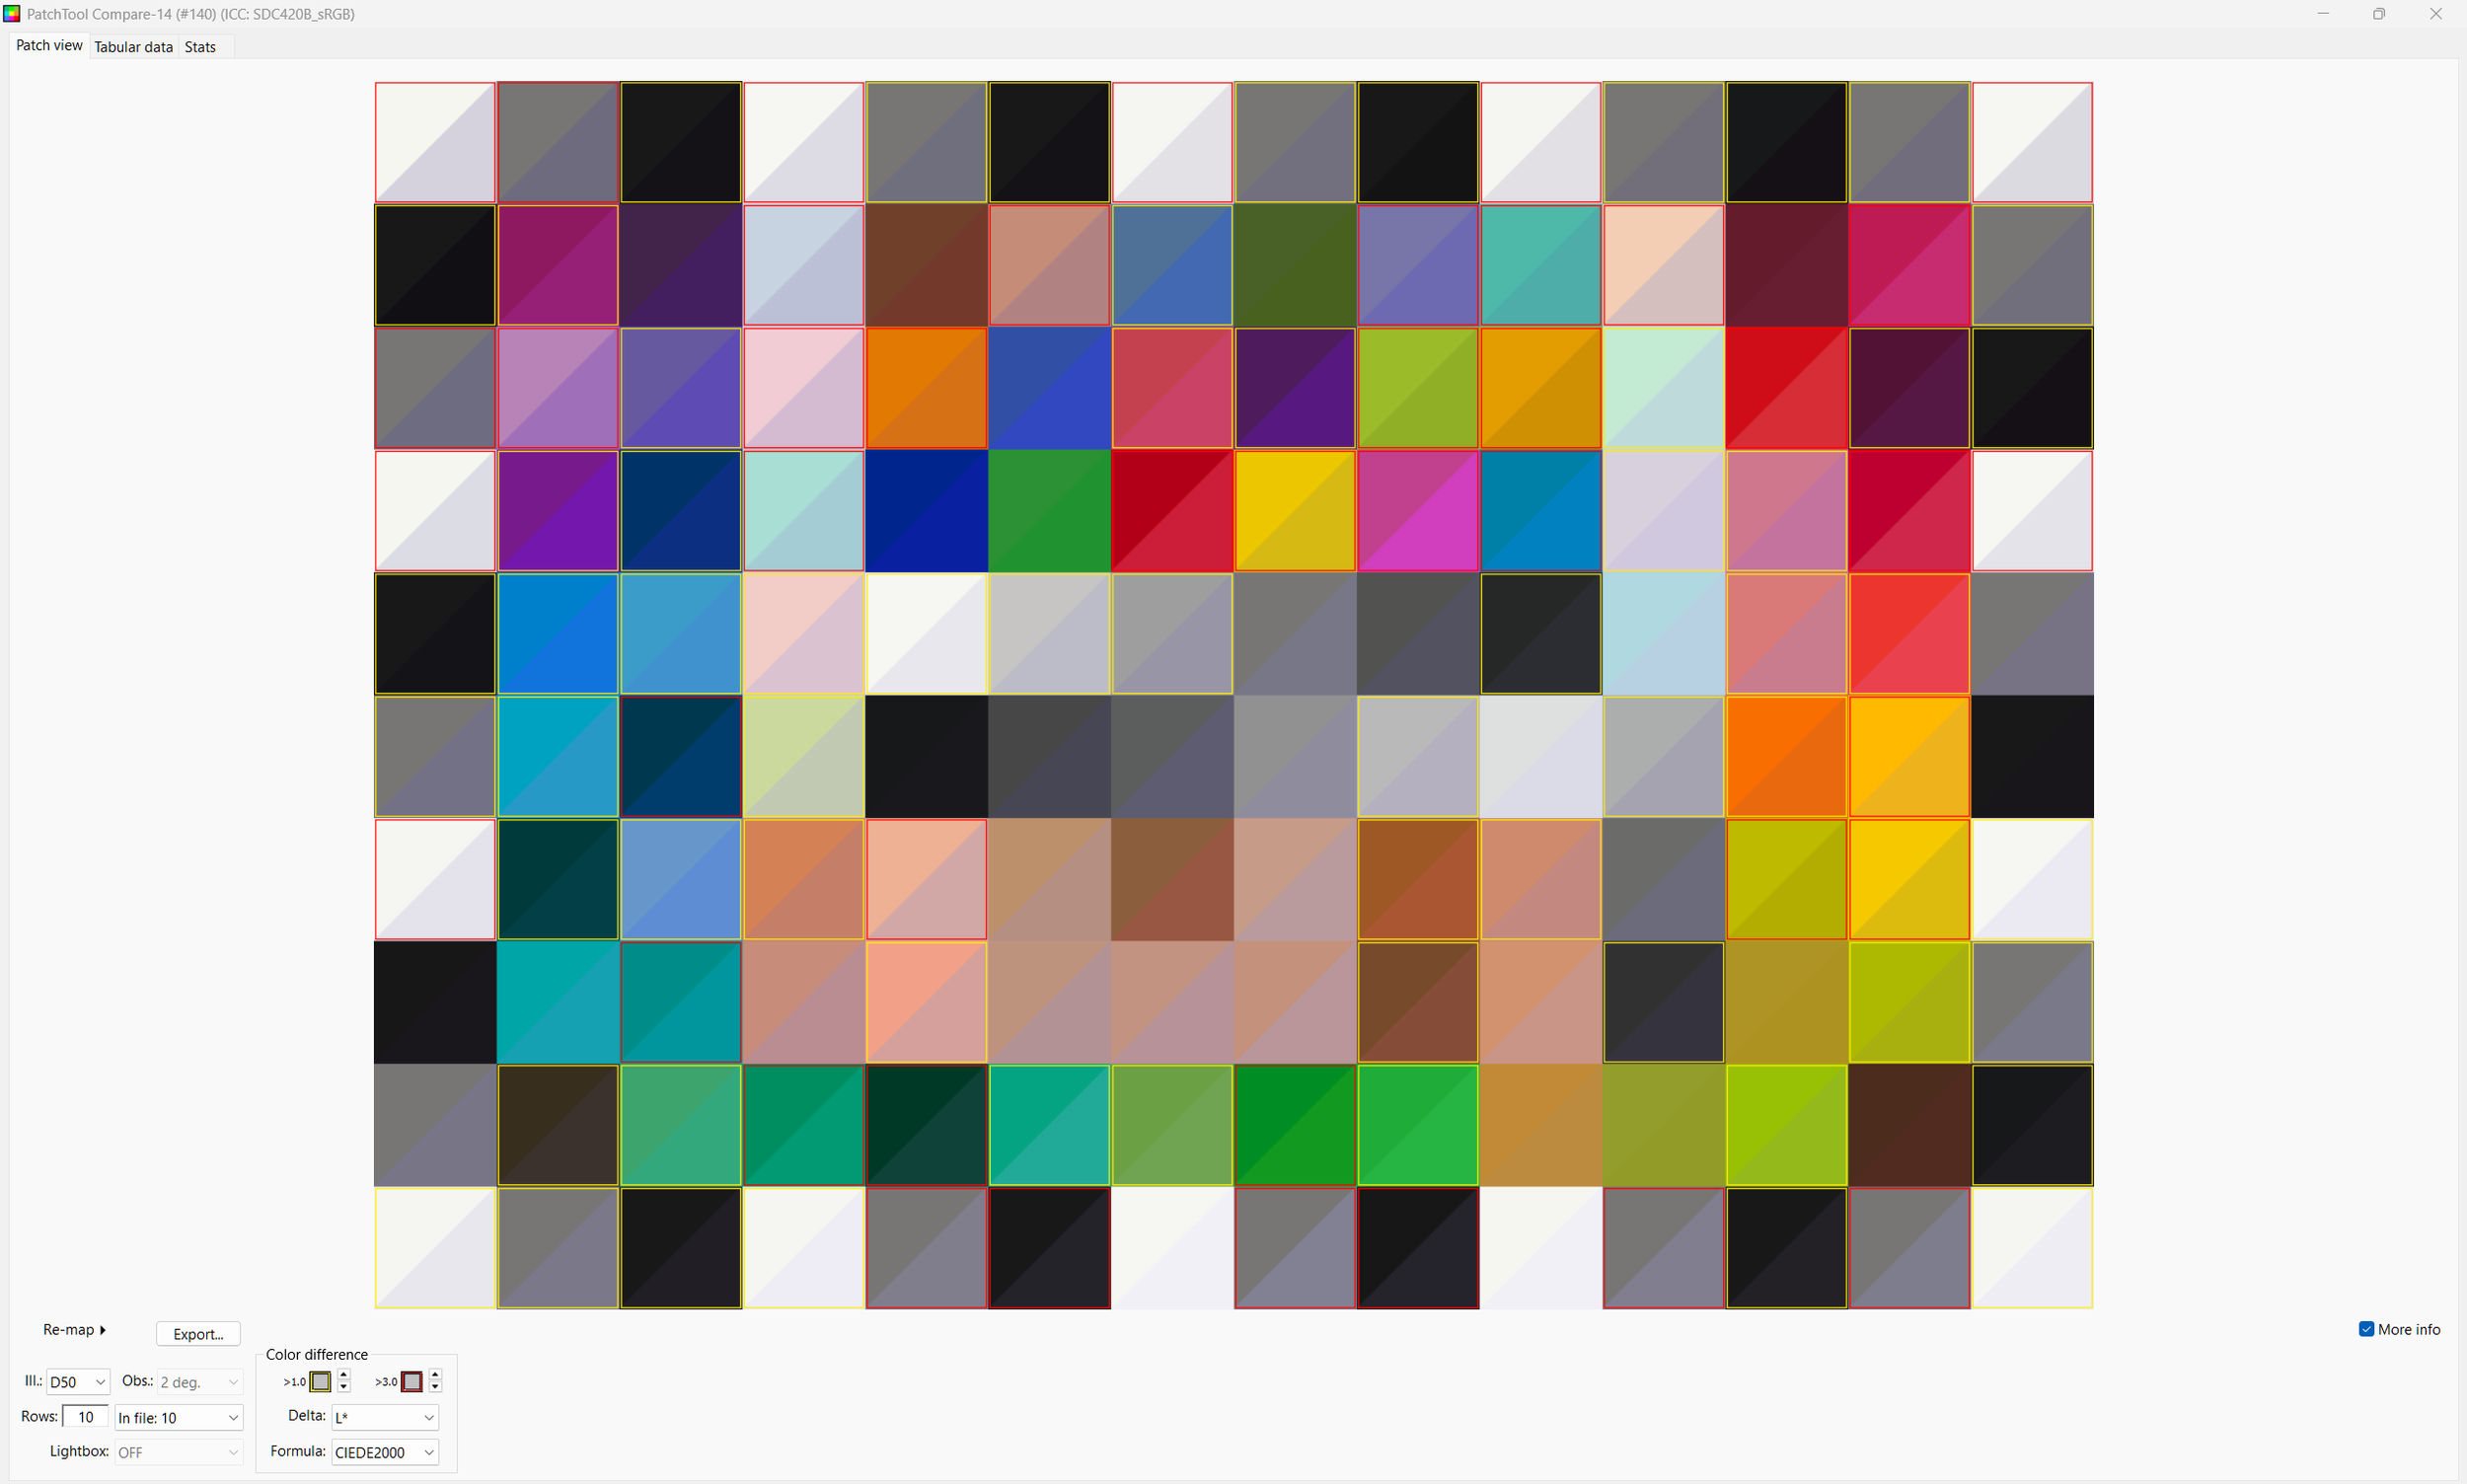
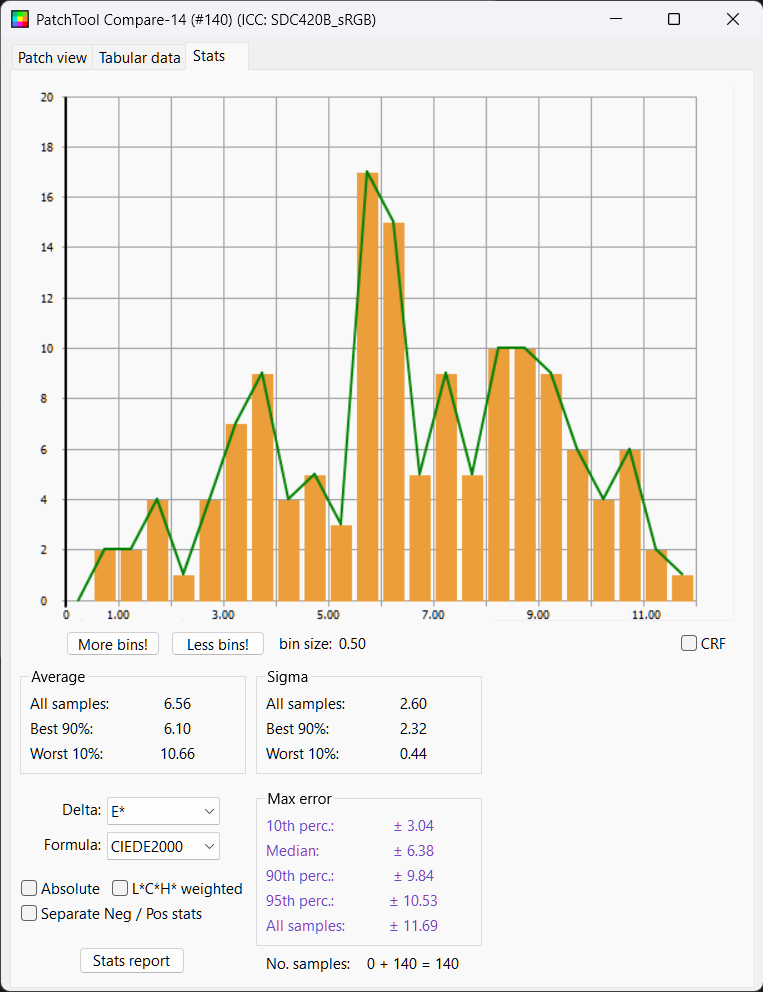
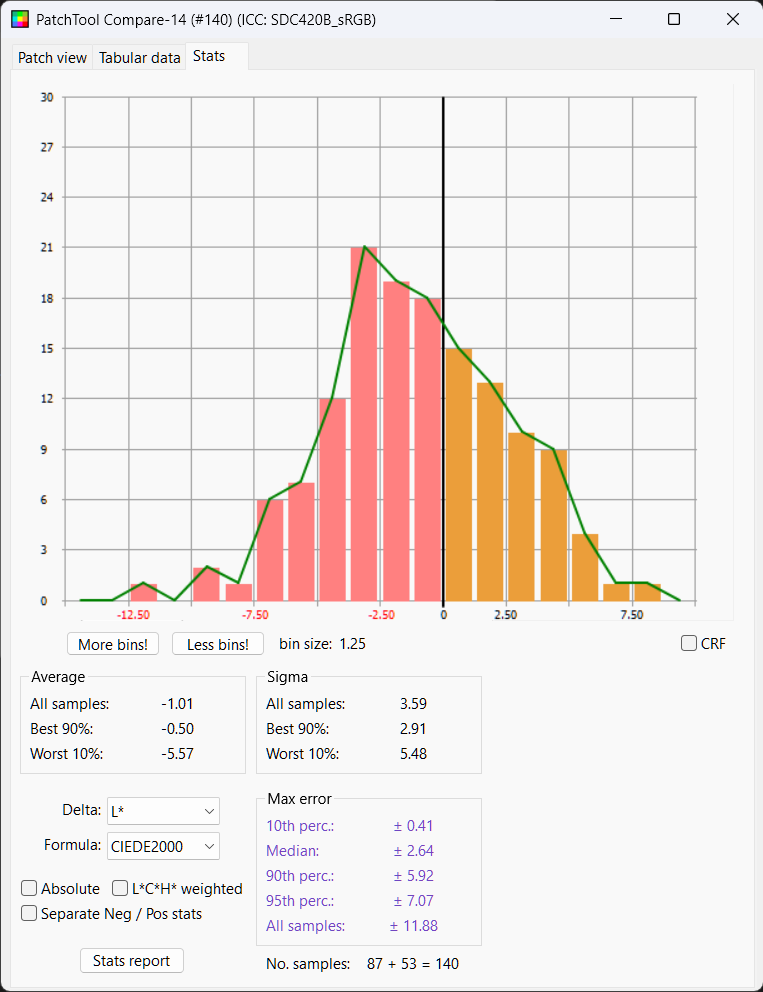
The spread of luminance values is now much closer centered about zero error with half the chips within delta L of 2.64, worlds better than the first two results. Delta E Mean is 6.56 and median 6.38, so about a full point better than the DJI lut.
The new Python produced lut has the following results;
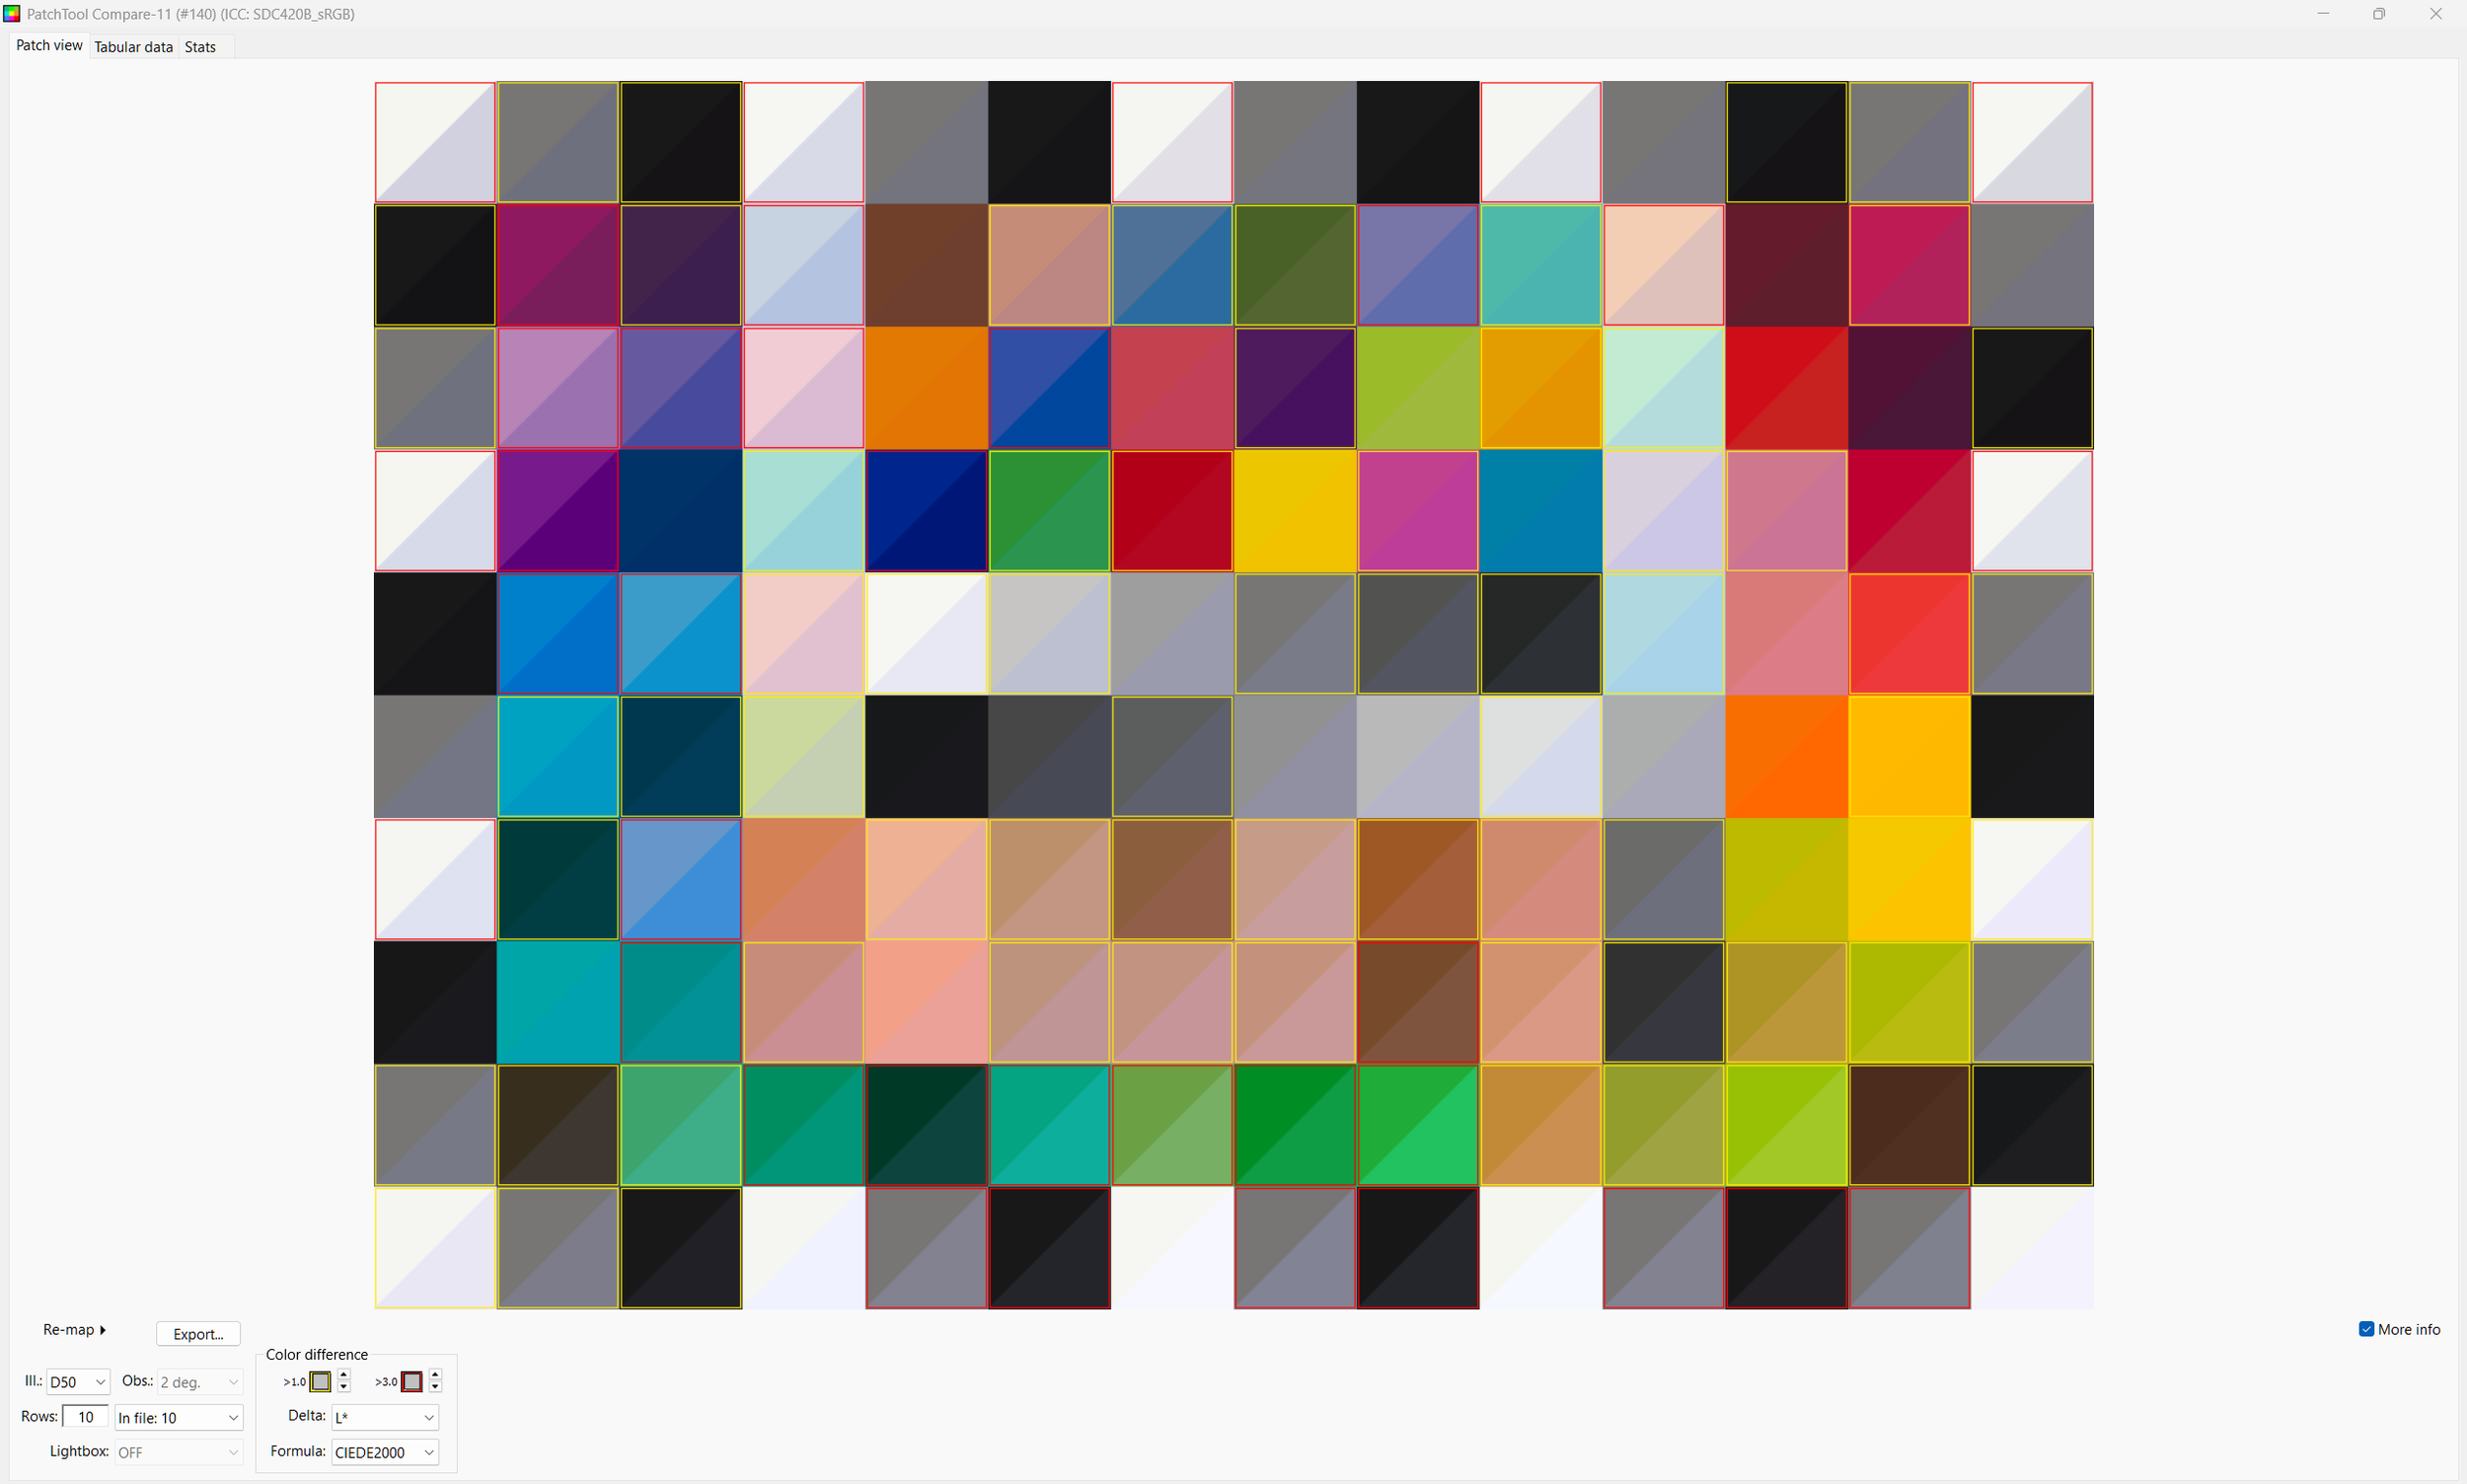
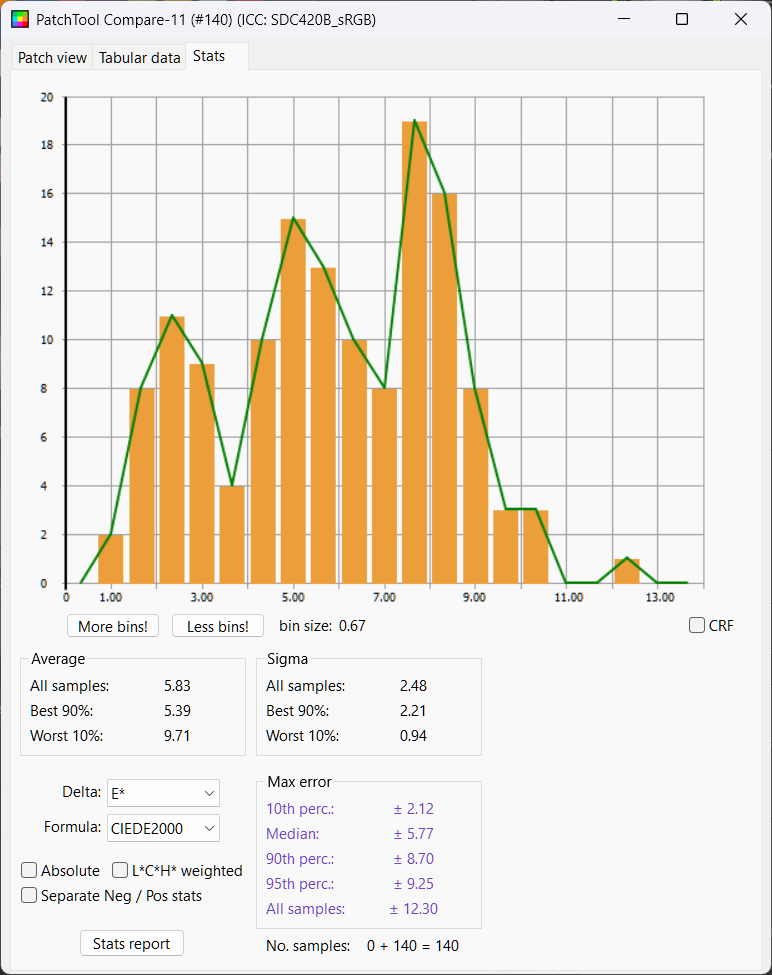
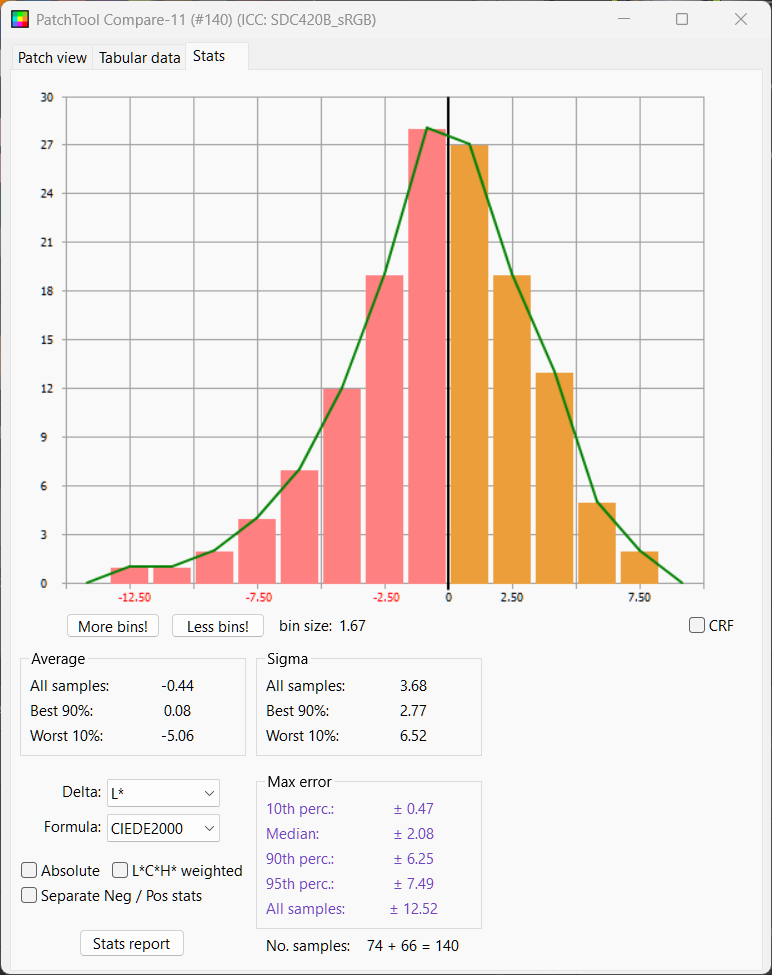
Some chips are practically perfect match to the eye. The luminance spread is again quite good with half the chips within delta L of 2.08, 57% the spread of the DJI LUT. Delta E mean is 5.83 and median 5.77, over half a point better than my prior power grade and closer to 2 points better than the DJI LUT.
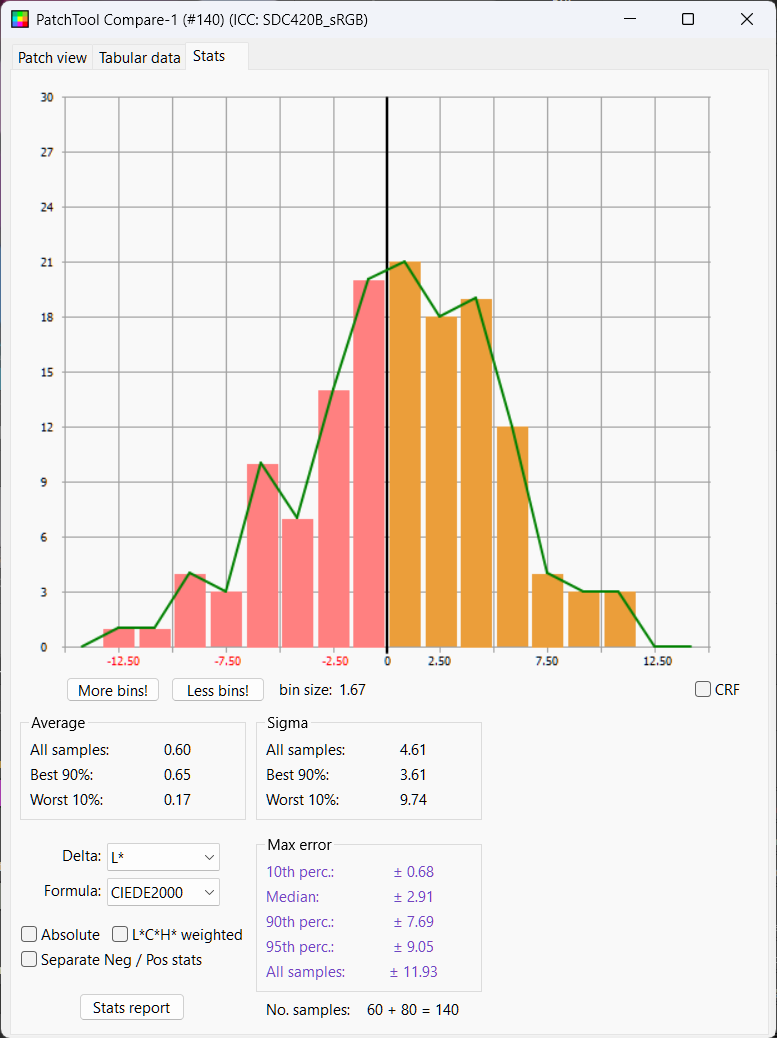
LUT Calc has Luminance spread almost perfectly centered around zero, with a spread of 2.91, so better than the LUT from DJI. The deltaE values are however not very accurate with a mean of 7.5 and median of 7.7.
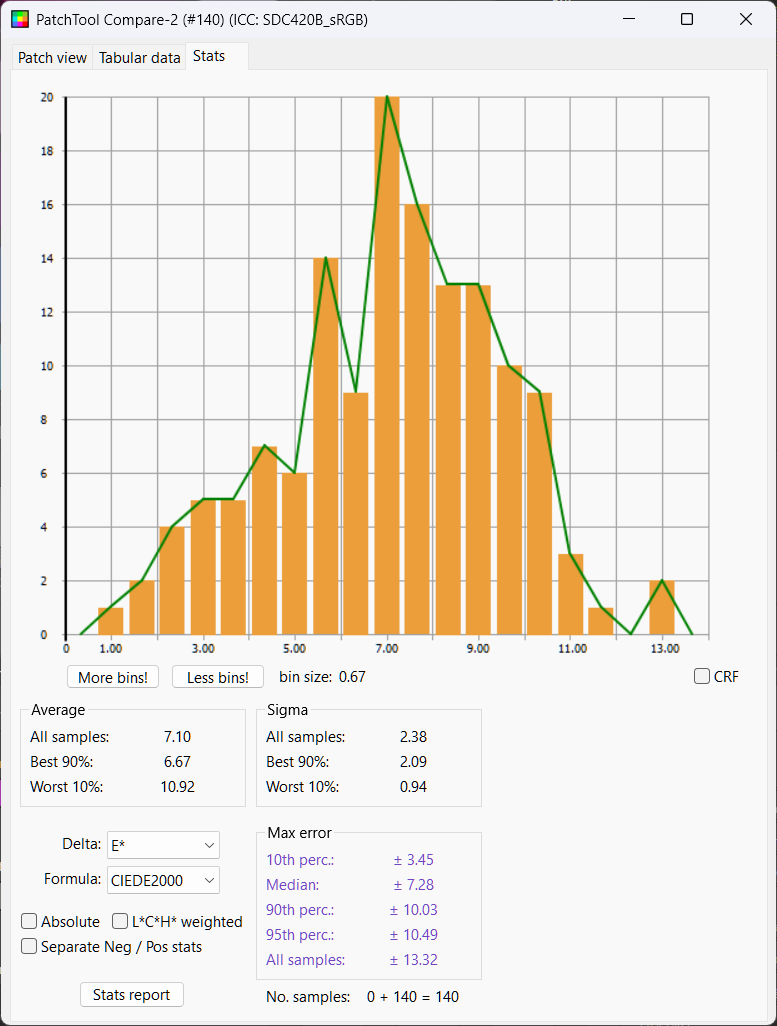
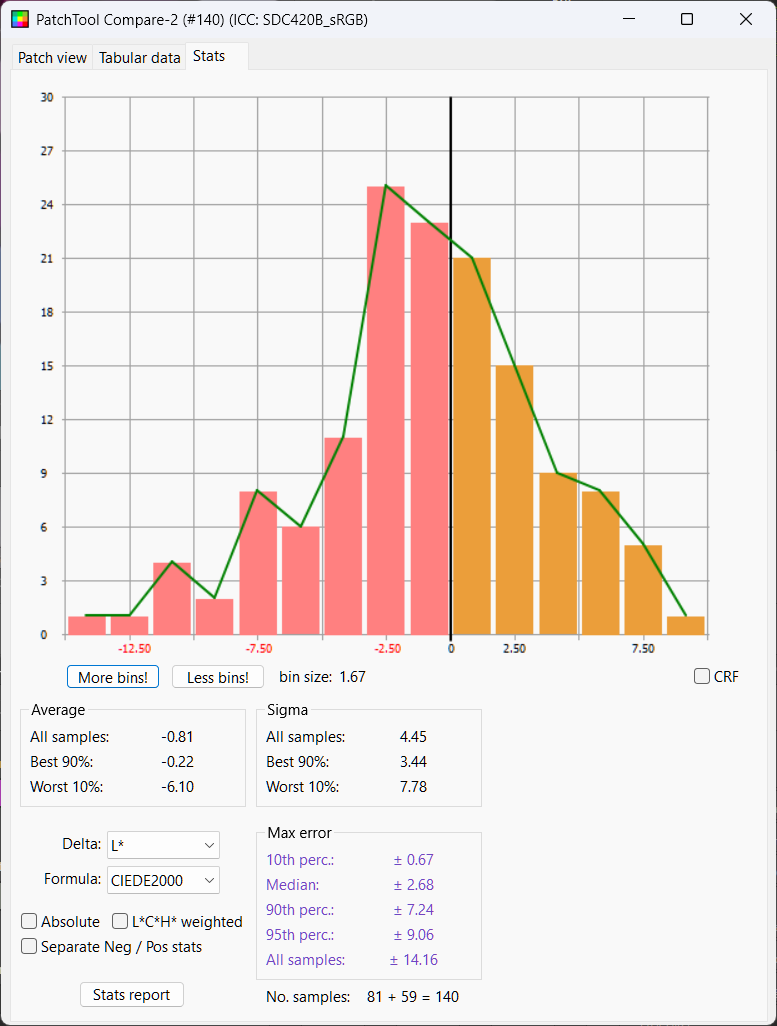
Thatcher's DCTL has a good result with deltaL of 2.68, deltaE mean of 7.1 and deltaE of 7.28
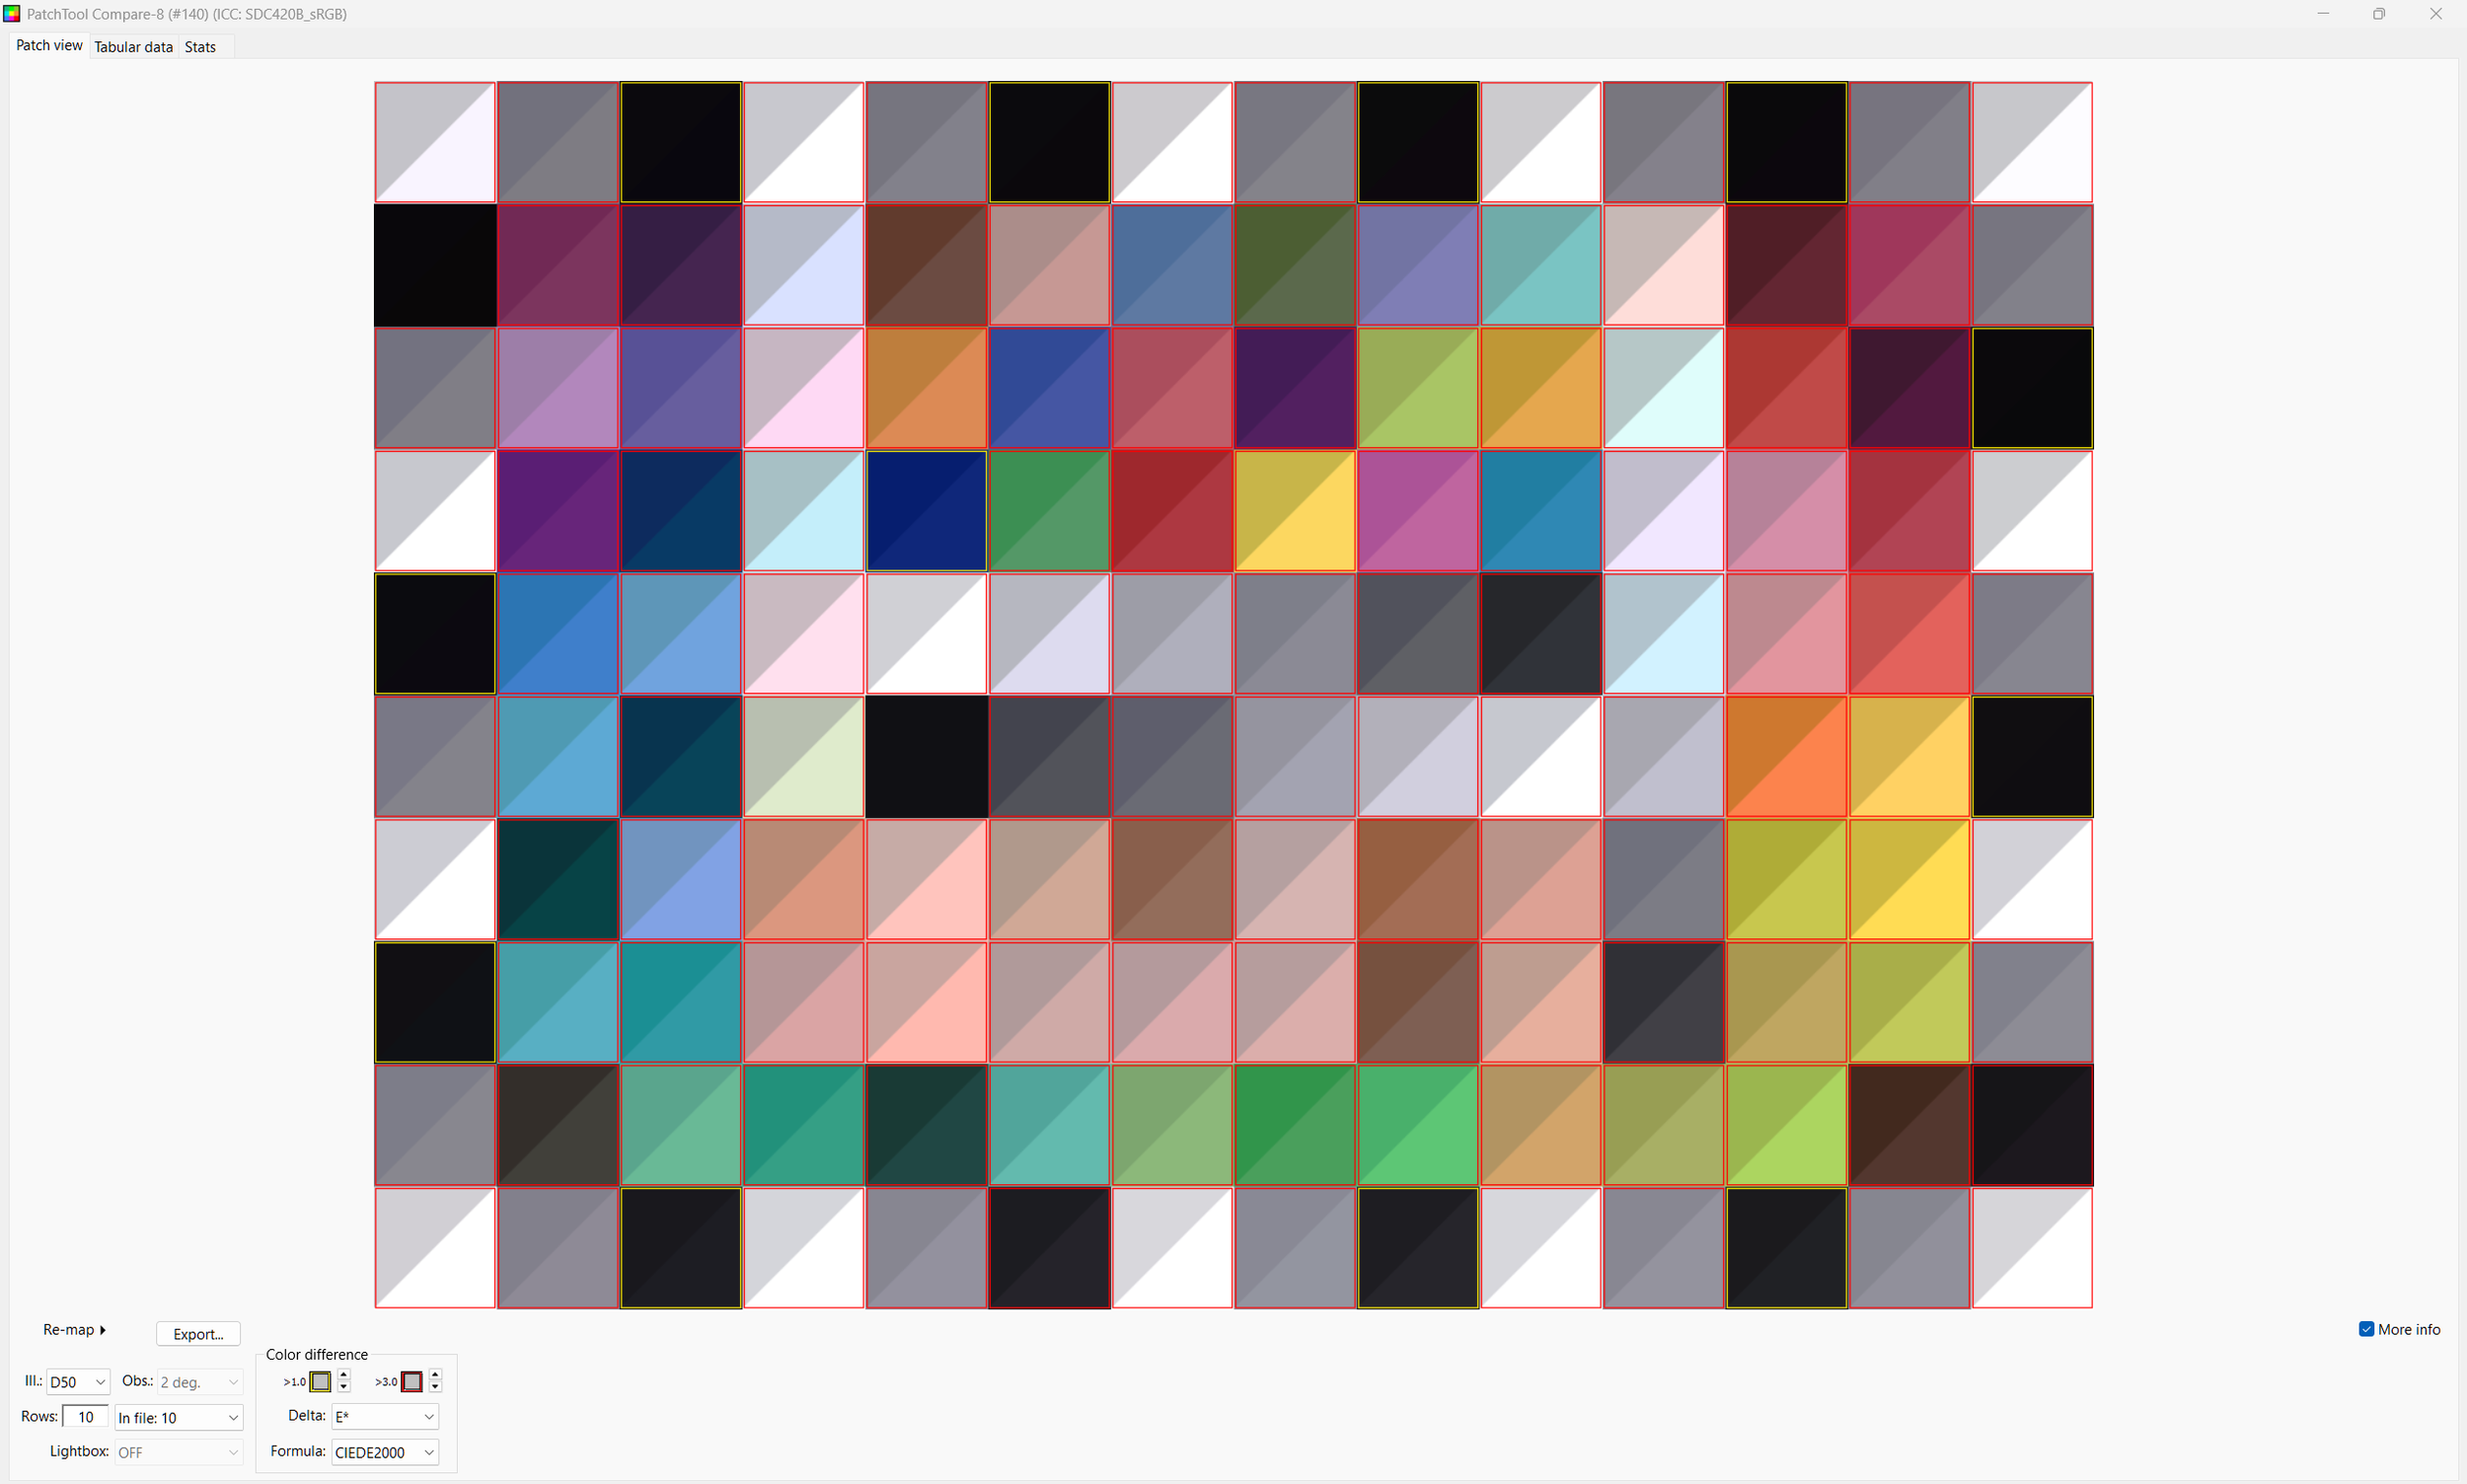
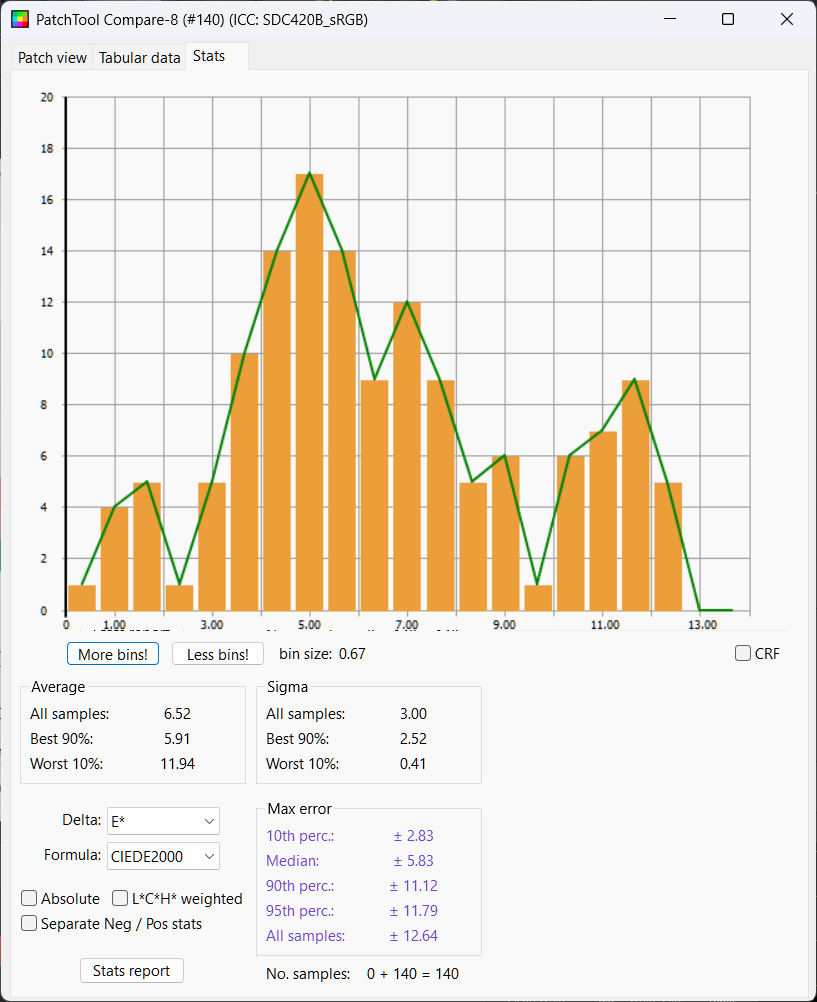
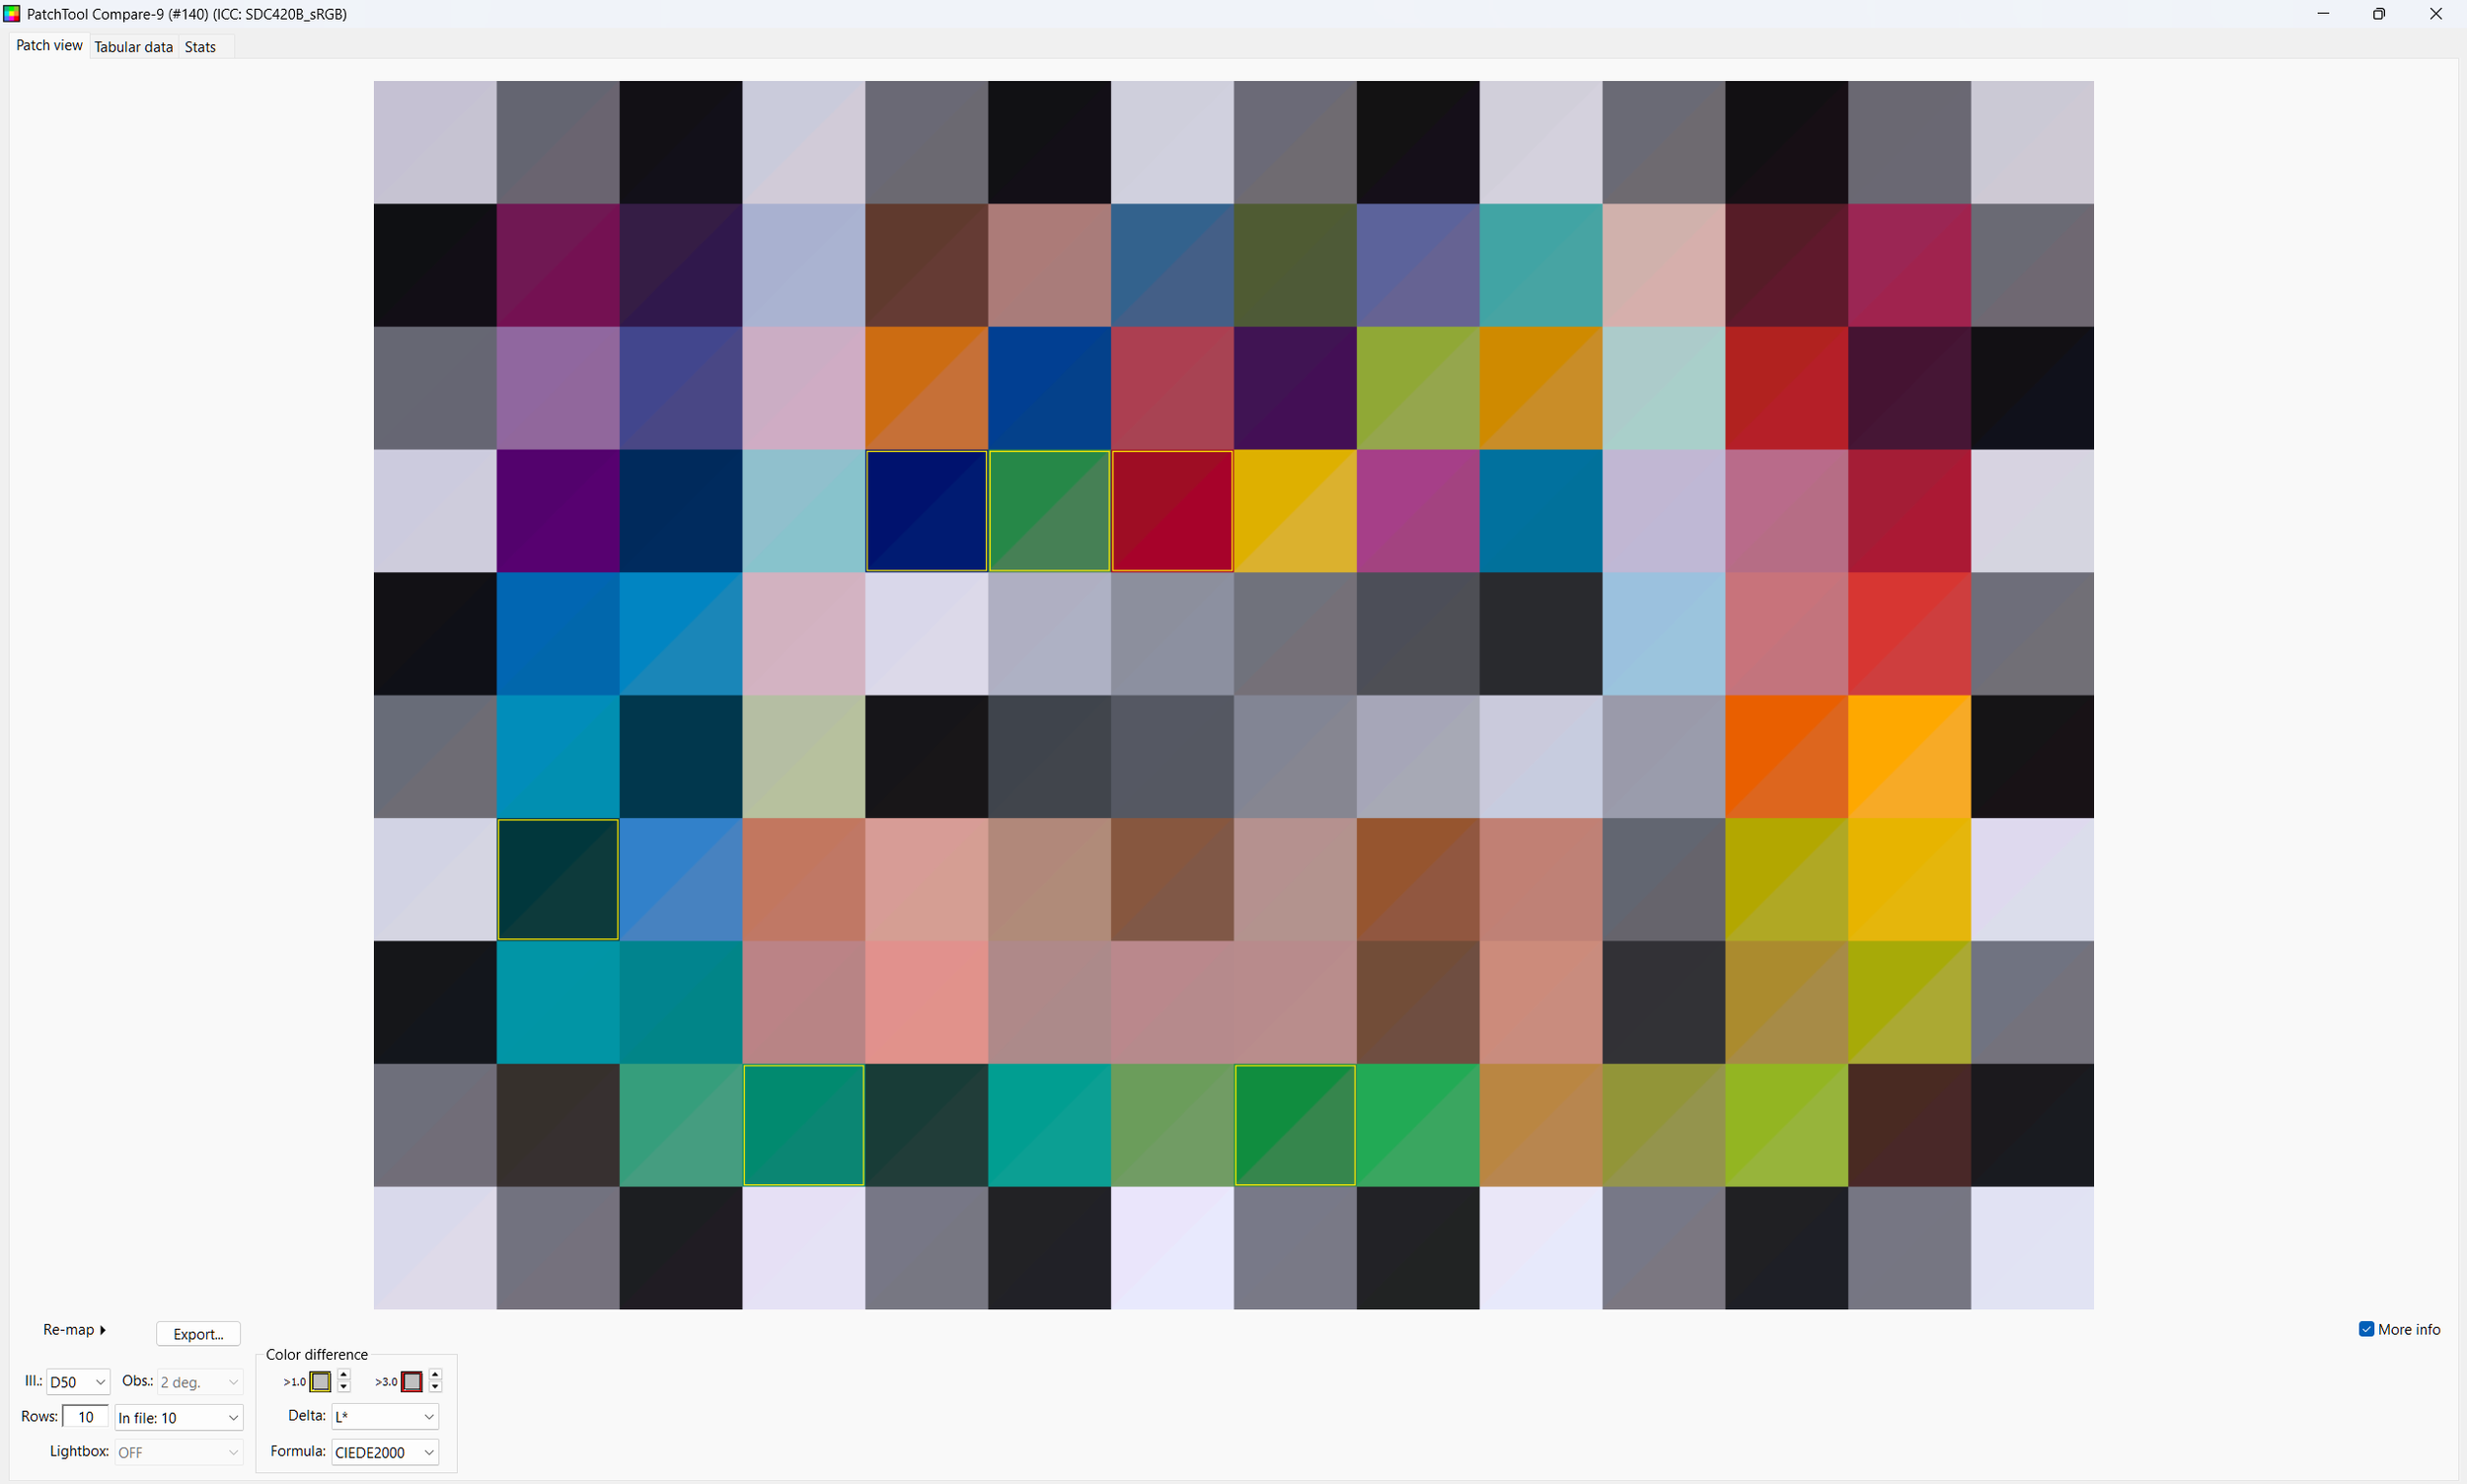
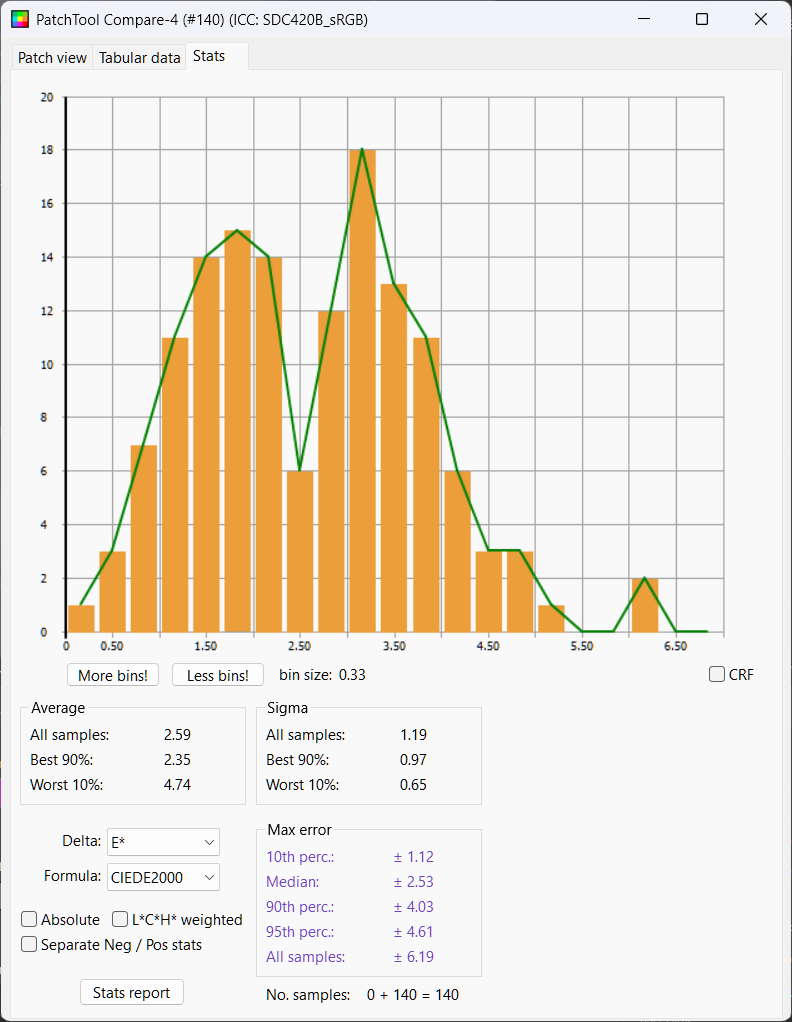
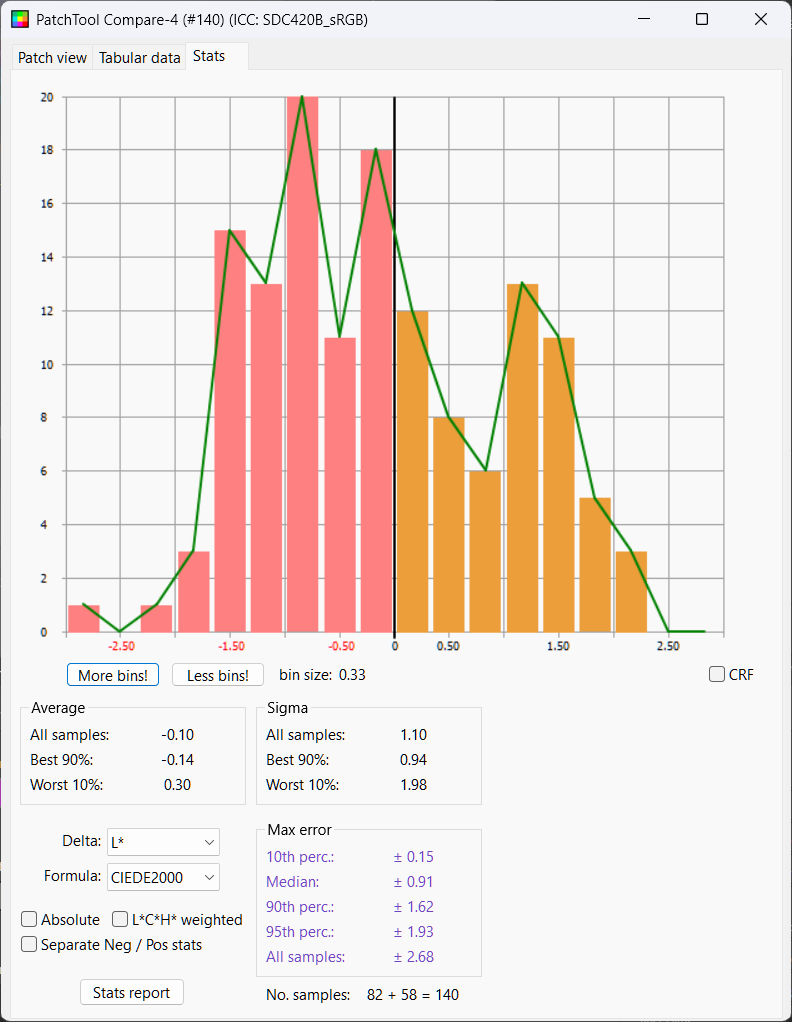
Another tool we can use to just the accuracy of the color space transform is if a shot is under exposed in camera 2 stops, eg shot at 1/200s vs 1/50s for +0EV, then can we raise it 2 stops in post and have it mostly match up with a shot that was +0EV in camera?
So I did exactly this, the -2EV shot raised 2 stops in Resolve will be compared against the +0EV shot.
SOOC: Delta E Mean 6.52, Median 5.83, Delta L 50%ile 6.14
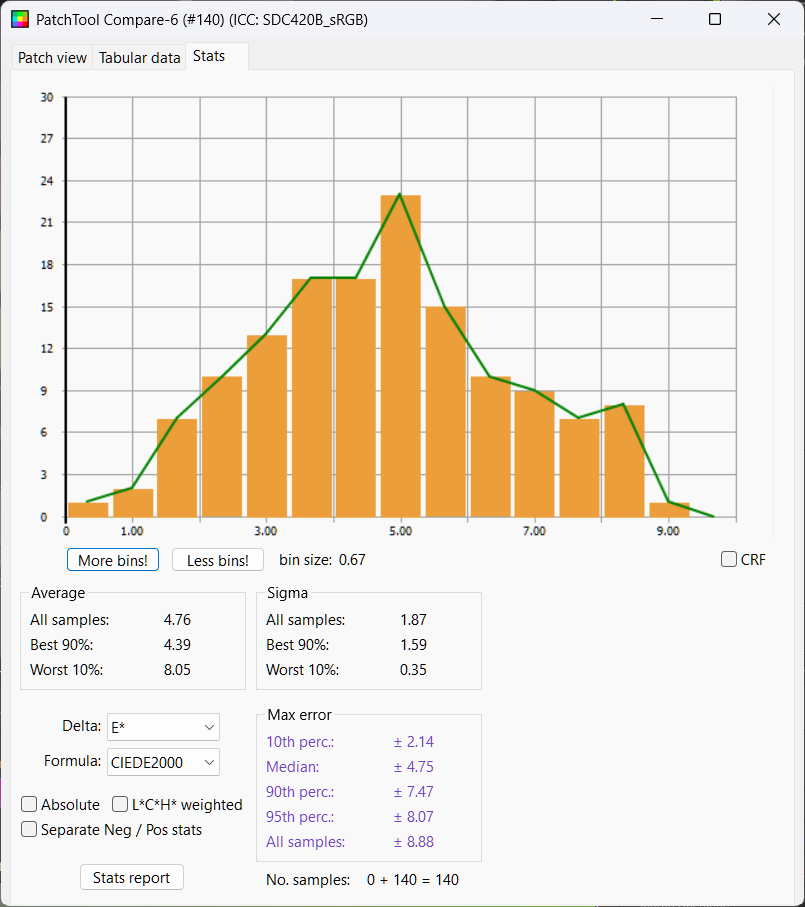
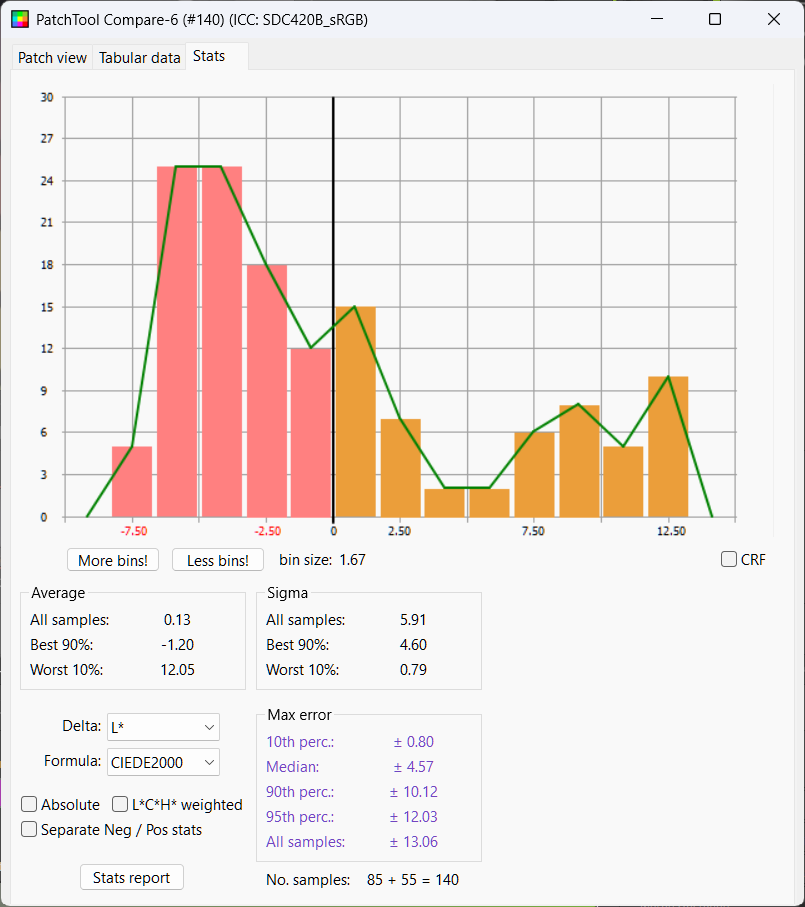
DJI LUT: Delta E Mean 4.76, Median 4.75, Delta L 50%ile 4.57
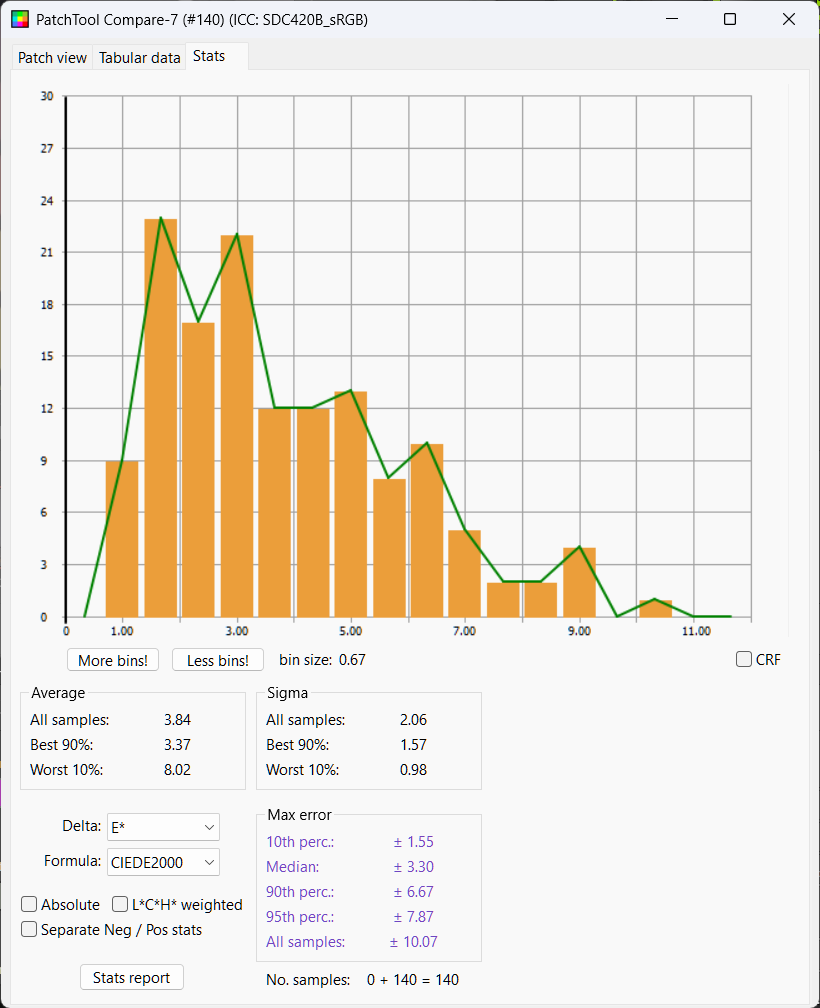
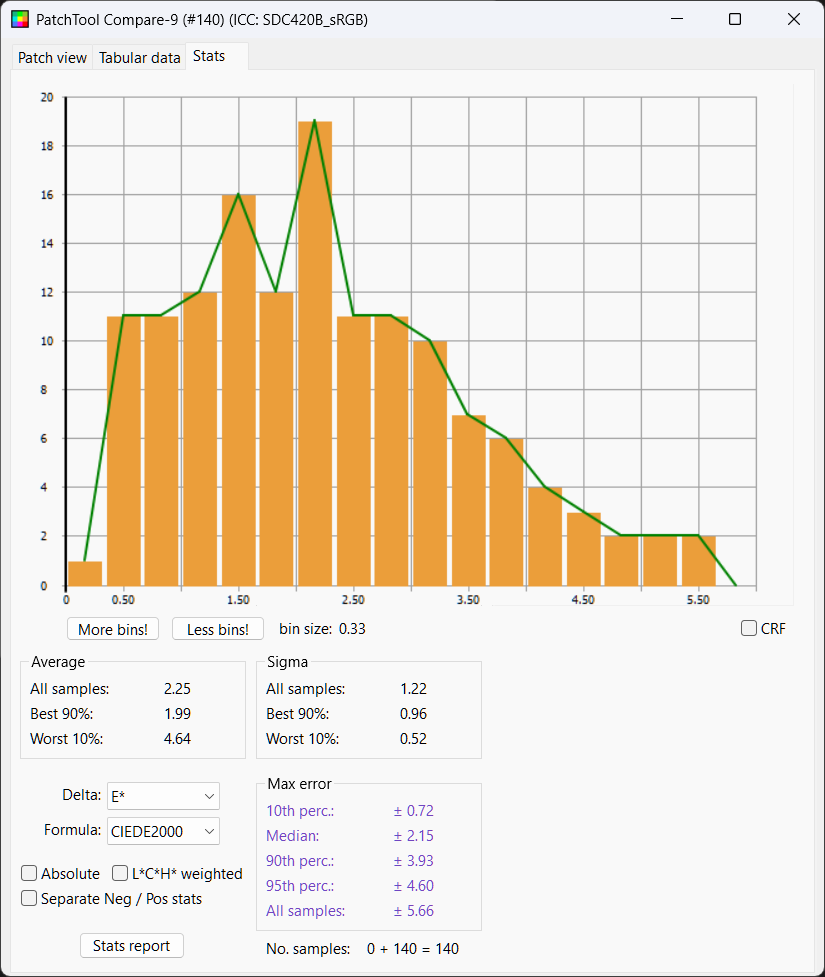
Prior Power Grade: Delta E Mean 3.84, Median 3.3, Delta L 50%ile 1.24
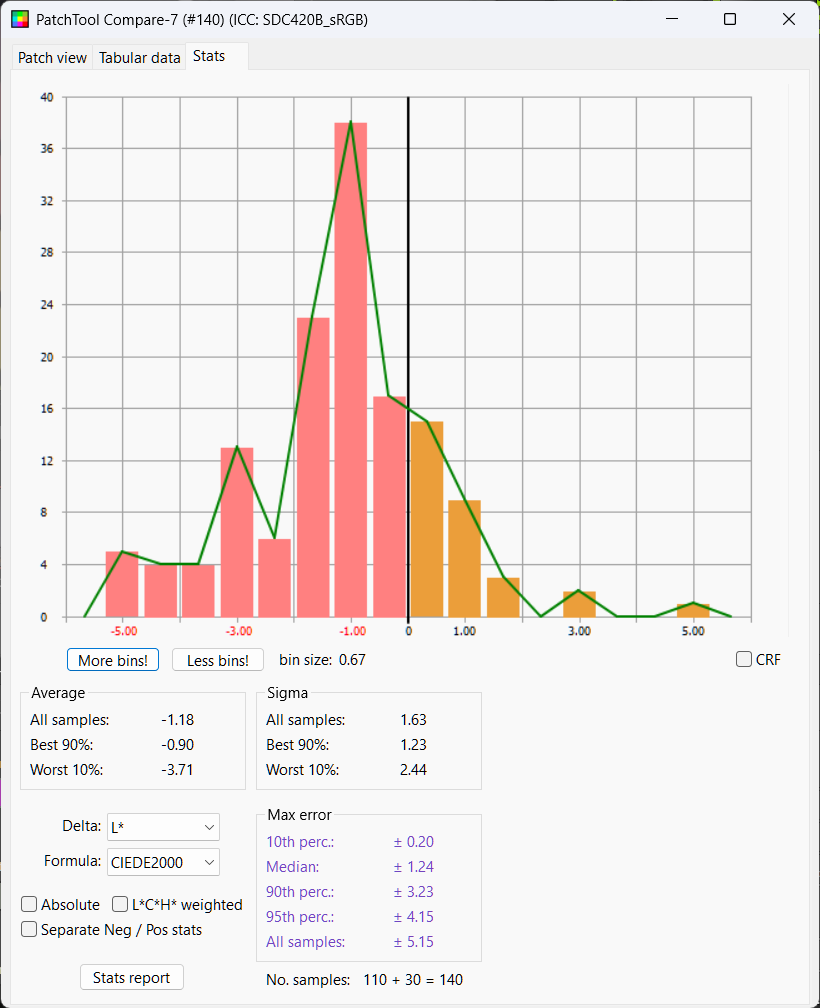
Python LUT: Delta E Mean 2.25, Median 2.15, Delta L 50%ile 0.28
LutCalc: Delta E Mean 5.6, Median 6, Delta L 50%ile 2.93
Thatcher: Delta E Mean 2.59, Median 2.53, Delta L 50%ile 0.91
So again no color management is clearly very poor accuracy, and the DJI LUT marginally better. As the python tool is building a tone curve to exactly minimize the delta L between charts it performs very well
Summary
This table summarize the results detailed above. We can see that the DJI lut shows remarkably bad results, not much better than no color management at all. The results from my Python program are even more accurate than the conversion power grade I previously built.
| CST Method | Delta L 50%ile | Delta E Mean | Delta E Median |
|---|---|---|---|
| SOOC | 4.25 | 7.91 | 7.48 |
| DJI Lut | 3.64 | 7.61 | 7.41 |
| Prior Power Grade | 2.64 | 6.56 | 6.38 |
| Python Lut | 2.08 | 5.83 | 5.77 |
| LutCal | 2.91 | 7.5 | 7.7 |
| Thatcher DCTL | 2.68 | 7.1 | 7.28 |
And here are the results of the -2EV chart raised two stops tested to the +0EV chart
| CST Method | Delta L 50%ile | Delta E Mean | Delta E Median |
|---|---|---|---|
| SOOC | 6.14 | 6.52 | 5.83 |
| DJI Lut | 4.57 | 4.76 | 4.75 |
| Prior Power Grade | 1.24 | 3.84 | 3.3 |
| Python Lut | 0.28 | 2.25 | 2.15 |
| LutCal | 2.93 | 5.6 | 6.00 |
| Thatcher DCTL | 0.91 | 2.59 | 2.53 |